Nebula GANTT Chart Widget
GanttChart
- Hours view (to control items down to the minute level) - which also adds 3 more zoom levels in that view.
- GanttSections to split chart into individual sections.
- Advanced tooltips and individual tooltips for events.
- Layering / Layer Alpha Opacities / Layer Showing and Hiding
- Event Date limiting (to lock it to a certain range)
- Fixed row heights / Group heights.
- Language settings.
- Color Themes (and easy to make your own).
- Lots and lots more. See screenshots below.
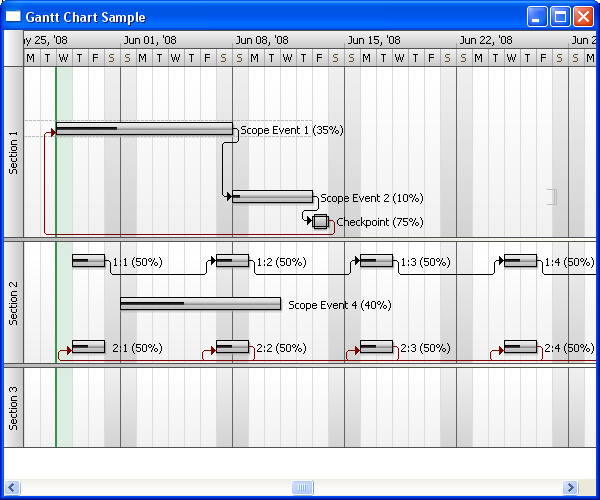
GanttChart (shown using GanttSections - Silver theme)
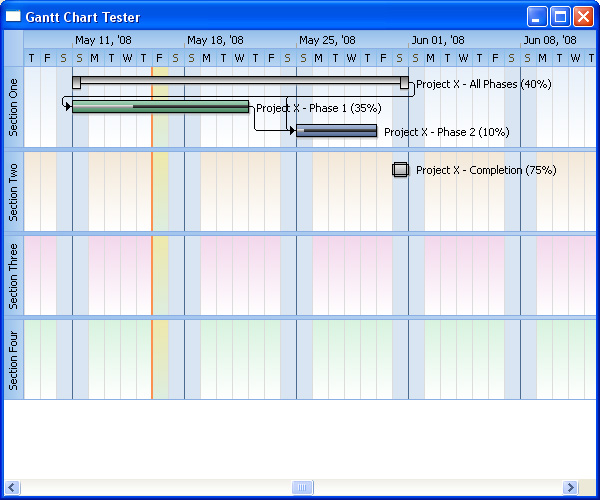
GanttChart (shown using GanttSections - Blue theme)
The GANTT chart is a fully customizable widget for displaying anything from a simple chart to allowing user interaction via drag and drop and resizing and well as dependency interaction.
The GANTT widget has taken hints from Microsoft Project as far as styles and overall look and feel goes. There are features such as dependencies, checkpoints, revised dates, and much more. Nearly everything is customizable and you can zoom in to detailed day views all the way out to yearly overviews (12 zoom levels). Events can be resized, dragged and dropped and various other things.
The widget is extremely simple to use for those wishing a basic implementation, or you can customize everything down to the pixel level if you so prefer. Basically, if you don't like something, change it!