[
Date Prev][
Date Next][
Thread Prev][
Thread Next][
Date Index][
Thread Index]
[
List Home]
|
[triquetrum-dev] A plain XY Plot actor in Triquetrum
|
For issue #48, I had to figure out a scope for an extra actor that can
be uploaded/added to a default Triquetrum RCP editor, using the eclipse
update mechanisms.
As everyone likes charts and plots, certainly for visualizing scientific
data, this seems like a fun example.
Using the Nebula XY Graph widget, it's easy to get a basic XY plot
implemented in Triquetrum, via an XYPlotActor.
This does not yet offer the full scope of Ptolemy II's plotting actors,
which is the scope of issue #39.
Here are 2 initial screenshots of the current state-of-affairs :
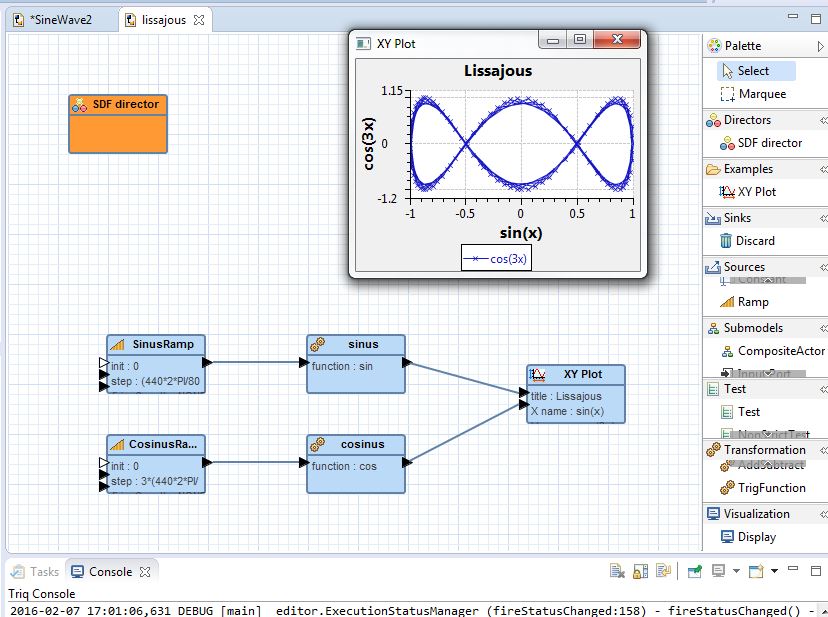
- when both inputs are connected, a real XY plot is produced, in this
case a Lissajous curve (https://en.wikipedia.org/wiki/Lissajous_curve)
(reminds me of the time I was still using oscilloscopes and soldering
irons ;-) )
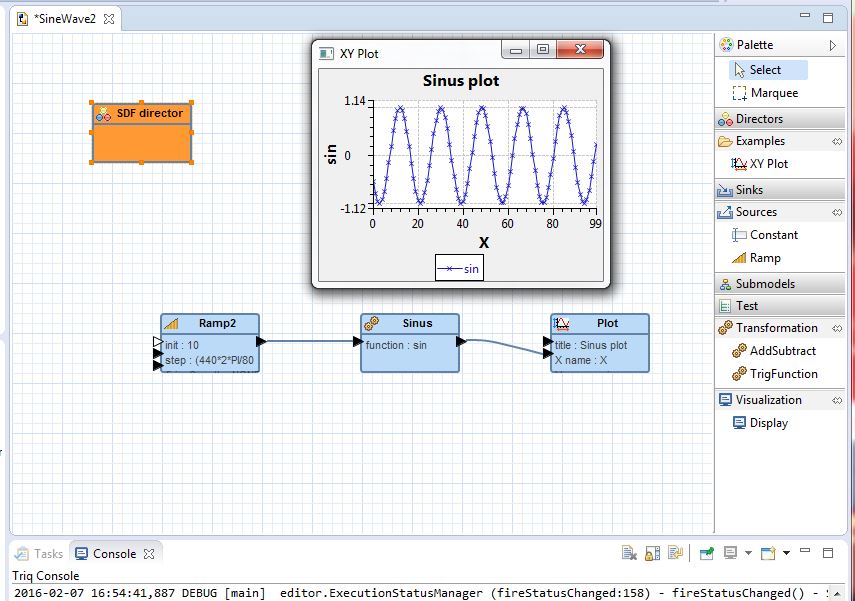
- when only the Y input is connected, the actor behaves as a sequence
plotter
Now onto the packaging and documentation on how to extend Triquetrum
with extra actors, to get that #48 closed!
regards
erwin
Attachment:
Triquetrum_plotshot1.JPG
Description: JPEG image
Attachment:
Triquetrum_plotshot2.JPG
Description: JPEG image