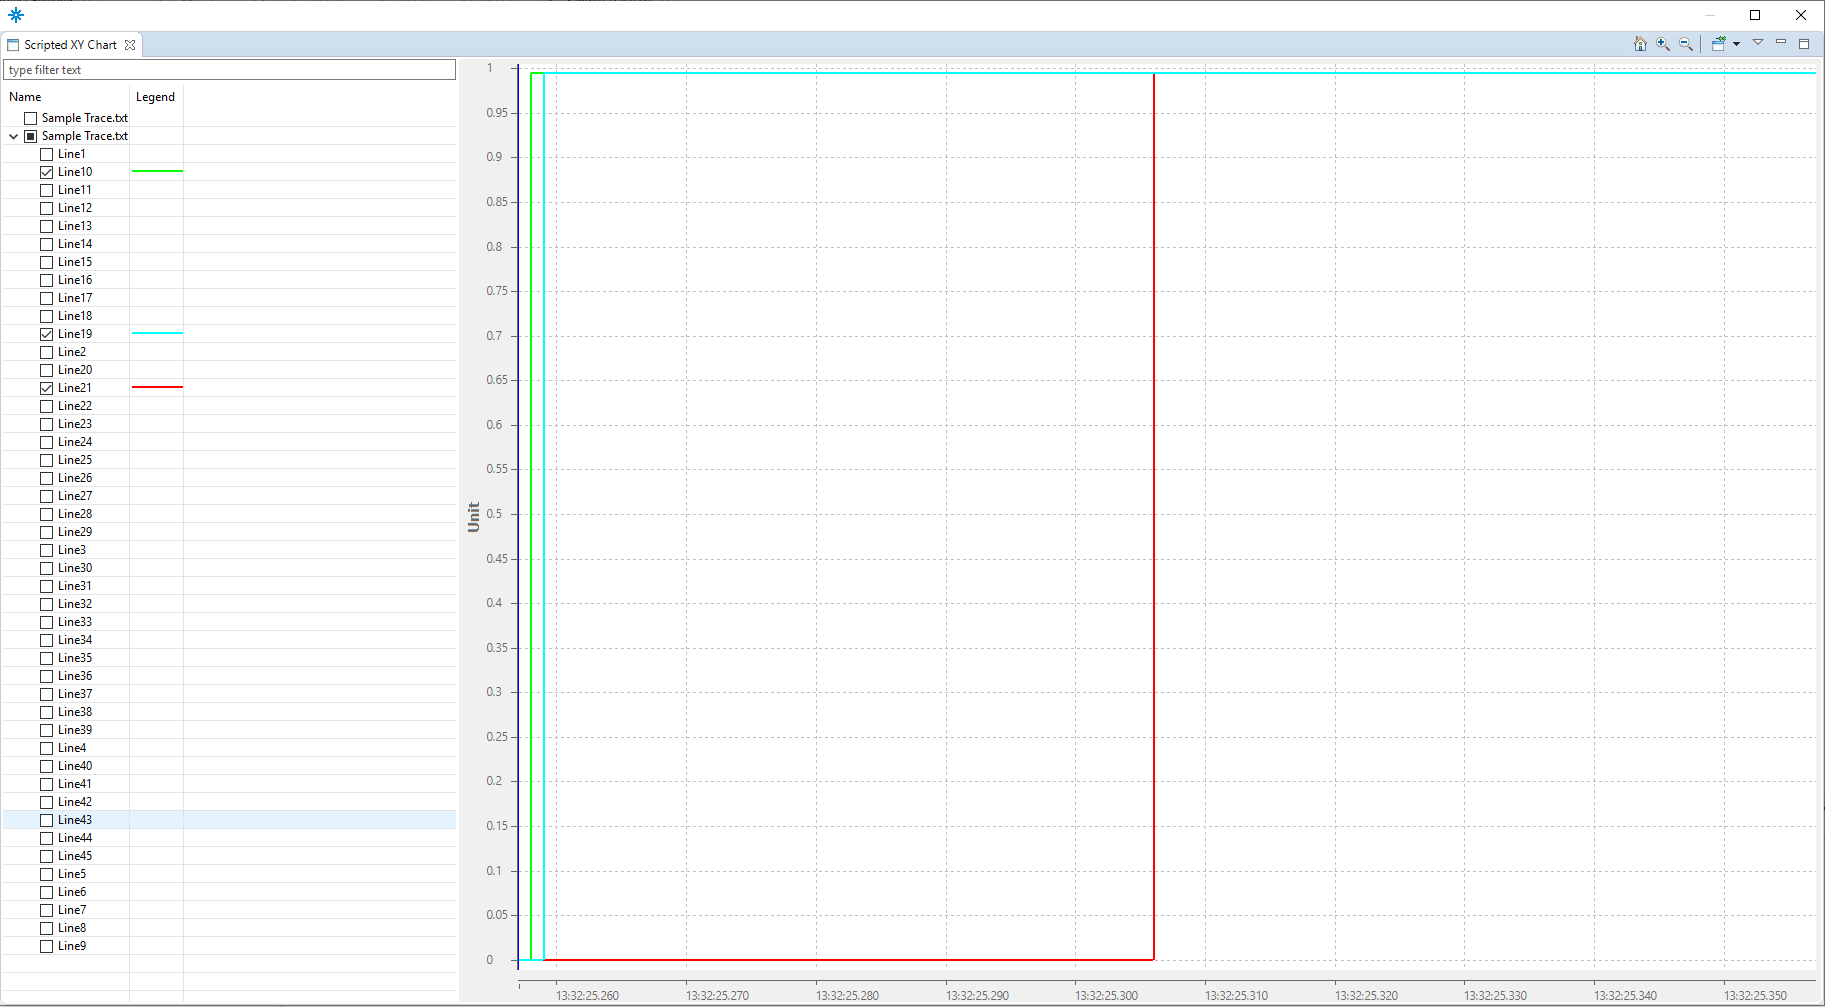
I have attached the script (Script.txt) and trace (Sample Trace.txt) files and also a screenshot of the XY chart (trace_XY_chart.PNG) that I am getting. As you can see in the screenshot, the Y axis is taking the quark values. How can I make it take the cpu_load values instead? (The third column in the trace file represents the cpu loads.)
I have also attached the custom parser that I have used (sample_trace_custom_parser.xml).
It's hard to answer your question without seeing what you did,
maybe you could share a screenshot or the script? In any case,
make sure the content of the state system that you are trying to
display is OK.
Look at task 6, that shows how to view what's inside your state
system before building a data provider. The next task creates a
time graph data provider, which could as well be an XY data
provider.
HTH,
Geneviève
On 11/15/19 2:22 AM, Basavaraj Munnoli
wrote:
Hello community,
I have a simple trace that has some event types along with
their cpu loads (in percentages) and timestamps. I want to
plot a simple line graph (timpestamp vs cpu load in %) for
each event type. I have followed the example scripts and by
using createXYProvider(analysis, map) and
openXYChartView(provider) functions I have been able to get a
line graph for each event type, with time stamp on the X axis.
However, the Y axis displays quark values. I am not getting
how to make my Y axis use the cpu load values instead of quark
values. Need support in this regard.
//This is the javascript file

loadModule("/TraceCompass/Trace");
loadModule('/TraceCompass/Analysis');
loadModule('/TraceCompass/DataProvider');
loadModule('/TraceCompass/View');

// Get the currently active trace
var trace = getActiveTrace();

if (trace == null) {
	  print("Trace is null");
	  exit();
}

// Get the Statistics module (by name) for that trace
var analysis = getTraceAnalysis(trace, 'Statistics');
print(analysis);
print(trace);
if (analysis == null) {
	  print("Statistics analysis not found");
	  exit();
}

// Prepare the parameters for the data provider:
var map = new java.util.HashMap();
print(map);
map.put(ENTRY_PATH, 'event_types/*');
map.put(ENTRY_DELTA, false);
print(map);
// create a XY data provider
var provider = createXYProvider(analysis, map);

// Open an XY chart with this data provider
if (provider != null) {
	  openXYChartView(provider);
}