Hi,
In current OpenChrom, it is not flexible to draw a rectangle in Edit Part to select the spectrum to expand it.
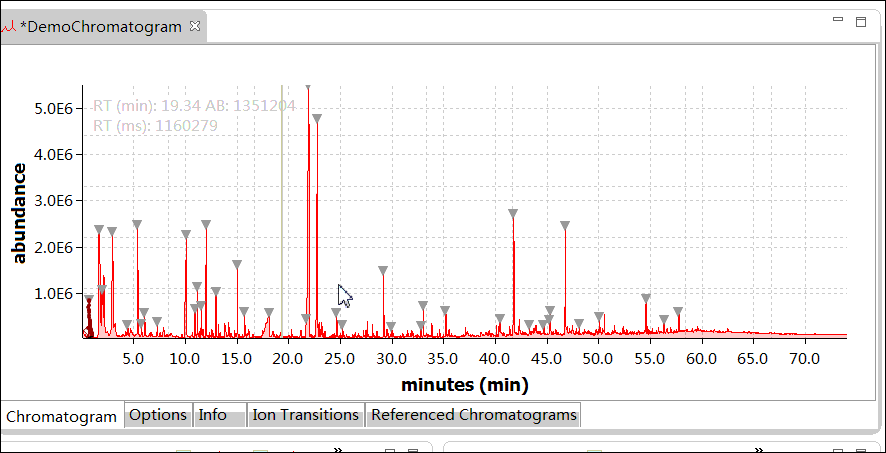
I made some effects in current mouse actions.
In the animation of attachment, dragging the mouse from left to right, the spectrum will be masked a semitransparent yellow rectangle to indicate the area to be expand. As the mouse relase, the masked area fill the full plot area.
As dragging the mouse from right to left, the spectrum will be reset in X-Axis.
As scrolling the mouse, the intensity of peaks increase or descrease.
To change the range of X-Axis, additional mouse gestures can be added, such as:
Dragging the X-Axis with the mouse from left to right, the start and end value of X-Axis increase with the distance that mouse move.
Dragging the X-Axis with the mouse from right to left, the start and end value of X-Axis descrease with the distance that mouse move.
The later two mouse gestures I have not implemented and not found the place in code source to modify, yet. Can anyone give me some help?