WebSocket Visualizer
To get a simple and instant impression of a simulation or to get an idea of how fast it runs or where a simulation is located, the WebSocket Visualizer was created. It runs in the browser and shows an OpenLayers Map with markers, indicating the positions of all vehicles, as well as overall the simulation progresses.
To start the visualization, simply open the tools/web/visualizer.html in your browser. As soon as
the page has finished loading all of its content, it starts trying to connect to the WebSocket created by
the Eclipse MOSAIC simulation. The WebSocket is also enabled by default for the tutorial scenario Barnim. For
more details see the file Barnim/output/output_config.xml.
<?xml version="1.0" encoding="UTF-8"?>
<configuration>
    <output id="websocket" enabled="true" loader="org.eclipse.mosaic.fed.output.generator.websocket.WebsocketVisualizerLoader">
        <synchronized>true</synchronized>
        <port>46587</port>
        <subscriptions>
            <subscription id="VehicleUpdates" enabled="true"/>
            <subscription id="V2xMessageReception" enabled="true"/>
            <subscription id="V2xMessageTransmission" enabled="true"/>
            <subscription id="VehicleRegistration" enabled="true"/>
            <subscription id="RsuRegistration" enabled="true"/>
            <subscription id="TrafficLightRegistration" enabled="true"/>
        </subscriptions>
    </output>
</configuration>
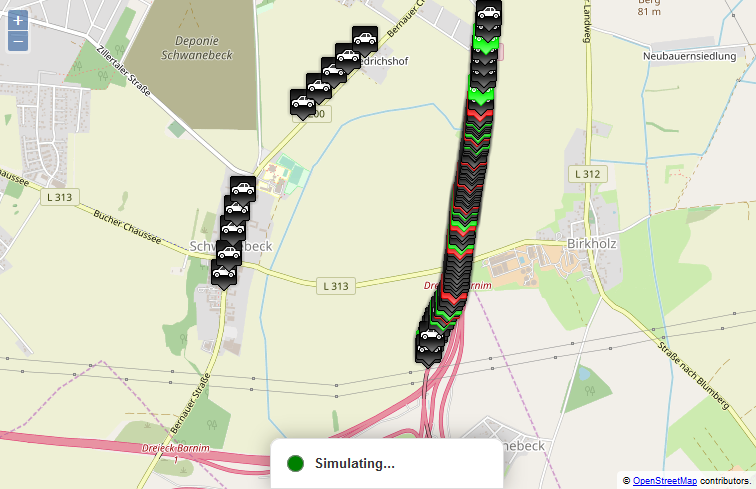
As soon, as the simulation is running, you should see vehicle markers moving around and indicating if they are sending V2X messages (green) or receiving V2X message (red).
The status bar at the bottom of the page indicates the current connection/simulation state. There are four possible states:
- Connecting - Trying to connect to the WebSocket opened by Eclipse MOSAIC.
- Simulating - Periodically fetching simulation data and updating markers accordingly.
- Simulation finished - The simulation has finished.
- Error - An error occurred. Either there was a problem caused by the WebSocket itself, or a timeout occurred while trying to connect to the WebSocket.
After the simulation has finished, you can click on the reconnect button and then run the simulation again.
You can also start the visualization at each simulation run, using the command line parameter -v. In that case,
Eclipse MOSAIC will automatically open the tools/web/visualizer.html in your default browser once the simulation
starts.
By default, the WebSocket Visualizer does not work on Microsoft Edge. UWP (UniversalWindows Platform) apps onWindows 10 do not have direct network access but are subject to a network isolation for security reasons, preventing localhost loopback by default. WhileMicrosoft Edge itself does allow localhost access, it treats localhost as an Internet site, which leads to restrictions e.g. for IPC over IP. To prevent this, an exception for Edgemust be added to the network isolation via the following command in an elevated command prompt:
CheckNetIsolation LoopbackExempt -a -n="Microsoft.MicrosoftEdge_8wekyb3d8bbwe"