Business Intelligence & Reporting Tools
This project proposal is in the Proposal Phase and is posted here to solicit community feedback, additional project participation and ways the project can be leveraged from the Eclipse membership-at-large. You are invited to comment on and/or join the project. Please send all feedback to the eclipse.birt newsgroup or the birt-proposal mailing list.
Project Organization
The Business Intelligence and Reporting Tools Project is a proposed open source Top Level Project of eclipse.org.The Project Charter describes the organization of the project, roles and responsibilities of the participants, and top-level development process for the project.
Project Principles
Among the key principles on which this project has been initiated, and will be run, are the following:Extension of the Eclipse value proposition - The Eclipse Project has set a high standard for technical excellence, functional innovation and overall extensibility within the Java IDE domain. We intend to apply these same standards to the business intelligence and reporting domain.
Leverage Eclipse ecosystem - A major goal of this project is to apply the application development strengths of the Eclipse Project to the business intelligence and reporting domain. The project will work closely with other Eclipse project areas whenever possible to leverage the capabilities being developed in those areas.
Vertical Solutions - Reporting and Business intelligence are a facet of almost all applications that are developed today. A core principle of this project is to provide a general purpose reporting capability that can easily and seamlessly be integrated as a component of vertical applications and solutions.
Extensibility - To meet the varied requirements for reporting and Business Intelligence, provide extension points that enable developers to adapt the technology to meet application specific needs.
Vendor neutrality - We aim to encourage Eclipse participation and drive Eclipse market acceptance by providing vendor-neutral capabilities and to encourage participation for complementary capabilities through additional projects.
Open, standards-based development - Where market adopted standards exist that meet the design goals, our aim is to leverage and adhere to them. Where market adopted standards do not exist, we will develop and publish any new capabilities in the Eclipse open forum.
Incremental delivery - In order to meet the pent-up demand for reporting within the Java application market, a goal is to delivery functionality to market as rapidly as possible via an incremental delivery model.
Agile development - Our aim is to incorporate into our planning process the innovations that arise once a project is underway, and the feedback from our user community on our achievements to date. We think an agile development and planning process, in which progress is incremental, near-term deliverables are focused, and long-term planning is flexible, will be the best way to achieve this.
Inclusiveness & diversity - We aim to assimilate the best ideas from the largest number of participants representing the needs of the widest range of end-users. So we will encourage organizations across a broad range of technical, market and geographical domains to participate in this project.
Project Scope
The Eclipse Business Intelligence and Reporting Tools Project will address
a broad range of needs in the business intelligence and reporting space
using the Eclipse platform.
The business intelligence and reporting space is focused on tools and
capabilities that extract data from data sources, process that data, and
present the processed information to the end users. The information may
be needed to enable the users to perform their operational or analytical
job functions, or it may be customer-centric information such as a transaction
statement. The capabilities can range from application- and production-level
reporting, through ad hoc user-driven query tools, to highly interactive
multi-dimensional online analytical processing (OLAP) and data mining
tools. While many business intelligence and reporting applications access
operational data sources, it is often the case that developers provide
specific data warehouses to support the business intelligence and reporting
needs of an application. The tools in this space can include facilities
to help build these data warehouses.
It should be noted that a given application often needs a range of complementary
capabilities in this area to meet the needs of different users of the
application. For example, consider components of an online order processing
application: The individual order invoices will be printed for inclusion
in the shipping box and the shipping clerk will need an online or printed
shipping list (both production-level reports); while a product line manager
may want to perform ad hoc queries to see which products generate the
most returns; while the purchasing agent may use analytics to look for
trends and improve stocking levels. Providing a range of coordinated and
complementary capabilities under the Eclipse Business Intelligence and
Reporting Tools Project is intended to ensure that the developed technology
can effectively be used to meet this broad range of needs.
Initially, the Project will focus on leveraging the Eclipse platform to
provide infrastructure and tools for the designing, deploying, generating
and viewing of reports in an organization. Over time, the creation of
additional projects is anticipated and encouraged to address additional
aspects of business intelligence, such as Online Analytical Processing
(OLAP), statistical analysis, Extract Transform and Load (ETL) tools and
so forth.
The initial deliverable of the Eclipse Business Intelligence and Reporting
Tools Project is to provide a robust platform that can be used to quickly
and effectively create and deploy reports with any degree of complexity
without having the developer create the data access, processing and formatting
logic using Java code or components. In the majority of cases, the report
developer will design a report within the Eclipse framework using a 100%
visual design paradigm. However, in recognition of the fact that the variety
of report layouts and complexity of data access is infinite, the project
will also support extensive programmatic customization of the report generation
processes, including programmatic creation of report designs.
Reports extract data from a data source or sources, perform manipulations
and calculations on the data to answer business questions, and present
the results as information in a formatted and convenient form for the
business user to use. This information is then typically used for operational
or decision support purposes within an organization. Reports vary dramatically
in size, content and complexity and will include or combine characteristics
such as:
- Listings of information (Example: Transactions in an account)
- Sorting, grouping and aggregation of data with and without subtotals (Example: A listing of all product sales for each sales person, grouped by state)
- Charts to present information in easy to understand formats (Example: Pie chart showing an investor's portfolio allocation by High Growth/Growth/Income/etc. categories)
- Matrix or cross-tab layouts (Example: Financial budget reports with cost codes as rows, columns for each month, and cells containing numerical data for that cost code/month)
- Delivery of information as one or a combination of web pages, PDF files, printed documents, Excel files, etc. (Example: Frequent flyer statement delivered as a web page online and a printed document in the mail)
- Precise, highly formatted layouts (Examples: Bank statements; utility bills; commission statements; invoices; government forms)
- Page navigation for long reports (Examples: Hundreds of pages corporate cell phone usage bill with First Page, Next Page, Goto Page, etc. buttons)
- Table of Contents (Example: Multi-page Investment Portfolio summary with Table of Contents to quickly navigate to Account Summary; Fund History; etc.)
- Keyword or content search within a report (Example: find information on a customer in a 1000 page customer account report)
For report development, the project broadly targets three classes of developer:
- Application Developers - These are Java developers who are creating applications that include the need to retrieve data and present that data in the form of reports. This is likely to be a subset of the overall application and will include many of the characteristics discussed above. In this case, the report generation and viewing will be embedded in the overall application.
- Report Developers - Report developers are not typically skilled in writing Java code. They expect to use a visual desktop tool to create any type of report - including defining database connections, report content and report layout. These reports may then be deployed as part of an application, or through an easy to use deployment framework.
- Business Users - Business users often want to create their own report layouts or customize existing reports. They work through a very easy-to-use web-based report creation and editing facility to answer business questions on an ad hoc basis.
The project will address both the design time needs of report creation
as well as the run-time requirements of report generation and deployment.
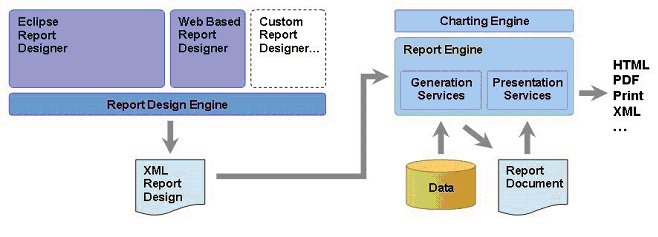
A high-level architecture diagram is provided below. The project will
adopt and support accepted open standards wherever feasible.
 The Eclipse Business Intelligence and Reporting Project is divided into
a number of sub-projects that reflect the initial focus on the reporting
aspects of business intelligence and the high-level architecture of the
project. These are discussed in the sub-project section below. As discussed
above, the creation of additional sub-projects is anticipated and encouraged
to address additional aspects of business intelligence.
The Eclipse Business Intelligence and Reporting Project is divided into
a number of sub-projects that reflect the initial focus on the reporting
aspects of business intelligence and the high-level architecture of the
project. These are discussed in the sub-project section below. As discussed
above, the creation of additional sub-projects is anticipated and encouraged
to address additional aspects of business intelligence.We expect the Business Intelligence and Reporting Tools Project to produce functional requirements that are more appropriately satisfied through the Eclipse Project or other Eclipse foundational projects. In such cases, the Business Intelligence and Reporting Tools Project PMC will coordinate the corresponding Project PMCs the design and implementation of the corresponding contribution.
Projects
Eclipse Report Designer
The Eclipse Report Designer is an Eclipse-based desktop authoring environment
for report development. Eclipse Report Designer enables application and
report developers to create simple and complex reports for use within
their organization. The tool recognizes and caters to the broad range
of report development skills from the non-programmer report developer
focused on report layout to the application developer looking for sophisticated
control over report creation.
Eclipse Report Designer provides:
- Visual report layout with precise control over report page design
- Extensive range of Wizards and Builders for no-code speed of development
- Component-based report development and reuse
- Template and style-sheet presentation model
- Ability to programmatically control any report behavior using Java (if needed)
- Data access direct to SQL databases, Java objects or other data sources
- Support for creating actionable reports that link to other content or transaction systems
- Interactive report features with full development control (e.g. click on column heading to sort report)
The Eclipse Report Designer will include and leverage a Report Design Engine that provides the services required by the user interface to create, edit and manage report designs. This design engine will be open and documented, making it fully accessible by other applications and products. Report designs can be created or manipulated programmatically for integration into custom report design environments for targeted uses. For example, as a flexible report feature seamlessly built into a finance application.
The Report Designer will provide a number of commonly requested integration points to support application-specific and general purpose extensions to the designer. Specifically:
- Fully extensible data access and query capabilities to support authoring reports against any target data source. This will include ability to extend the Report Designer with custom query builder user interfaces and data access logic.
- Easy integration of code to incorporate complex and/or application specific business logic into report designs.
- Extensible model that allows new visual components to be incorporated into reports (for example, new graphical representations of data).
Web Based Report Designer
The Web Based Report Designer project delivers a fully customizable, 100% HTML based tool for creating reports with basic layouts and data manipulation. The tool will leverage components such as style sheets and templates created using the Eclipse Report Designer. In addition, the tool will provide an Eclipse-based customization facility for the user interface for full branding and embedding within Java applications. The goal of this project is to provide an accessible and easy-to-use report design environment to meet the needs for ad hoc report creation by business users within any java application.
Web Based Report Designer ultimately will support a number of report design capabilities, including:
- Ability to select, sort, group and filter data
- Support for cross-tab reports and charts
- Support for formatting control (column position, fonts, colors)
- Ability to apply templates and style sheets for layout and formatting
- Advanced reporting features (subtotals, …)
- A highly customizable user interface for integration into any Java application
- Extensible user interface to support additional application specific or general purpose reporting capabilities
Report Engine
The Report Engine project enables XML report designs created by the Eclipse Report Designer, Web Based Report Designer or any other tool to be deployed as an embedded component within a J2EE application. To support this, the Report Engine provides two core services: generation and presentation.
Report Generation Services: The generation service within the Report Engine is responsible for connecting to the specified data source(s), retrieving and processing the data (sorting, grouping, aggregations, etc), creating the report layout and generating the report document. Report content can immediately be viewed using the presentation services, or saved for use later (permitting snapshot views of reports to be retained over time).
Report Presentation Services: The presentation service within the Report Engine provides a rich set of viewing capabilities for report content. This includes the infrastructure for viewing a document online (rendering to HTML, page by page navigation, etc.); for printing a document; and for generating alternate output documents such as PDF. These are all sourced from the same initial output document, enabling the same content to be targeted for different delivery vehicles within the same application (for example, a transaction statement that is viewed online as HTML and is also available for offline distribution/viewing via PDF).
Both the generation and presentation services provide support for the extension points discussed in the earlier sections of this proposal. In addition, the output formats supported by the presentation service is also extensible - enabling documents to be targeted for specific display devices.
The Report Engine allows Java application developers to quickly integrate powerful report generation and viewing capabilities into their applications without having to build the infrastructure from lower level Java components.
Charting Engine
The Chart Engine project provides a rich business chart generation capability that can be used as a standalone charting component, as well as providing the chart generation service within the Report Engine project. Visual presentation of business data in the form of charts is a common, and key, aspect of many reports and other forms of business intelligence. As such, a robust charting capability is essential within the overall Business Intelligence and Reporting Tools project.
The Chart Engine will allow Java application developers to provide data to the engine in a pre-defined format and to provide an XML file that specifies the characteristics of the chart that will be generated. The project will include an Eclipse-based design component to facilitate visual design of the chart to be created.
Initial scope for the Chart Engine project is focused on the production of chart images that can be embedded in a report. Future enhancements would potentially include interactive chart viewing capabilities that allow users to, for example, change the chart type and rotate charts at view time.