[
Date Prev][
Date Next][
Thread Prev][
Thread Next][
Date Index][
Thread Index]
[
List Home]
|
[tracecompass-dev] UI for external analyses
|
Hi all,
I am currently working on finishing up the integration between Trace
Compass and the lttng-analyses project [1]. For those not familiar with
it, this is a set of scripts that can be run on LTTng traces to extract
statistics, graphs etc. in different categories (I/O, scheduling, CPU
usage, and so on). The integration with Trace Compass will allow calling
these scripts directly from the UI, and reporting the resulting in
tables or charts in Trace Compass.
One thing I am wondering is how to present this new feature in the UI.

Some background information first:
Trace Compass has the notion of "analysis", which means "something that
runs on a trace". Typically those analyses first create some indexes,
statesystems, etc., and then show their results in views (like the
Control Flow view, CPU Usage view, etc.). These views are dynamic, which
mean they will follow time range selections and update what they show
accordingly.
However, "external" analyses like the lttng-analyses function a little
bit differently. They do not run automatically on a trace, instead the
user decides to run them, either on the whole trace or on a given time
range. The results are then shown in static tables or graphs. Unlike the
"dynamic" views from before, these tables will not update their
contents. They just show the static results of the analysis, which we've
been calling "report".
So it goes like this:
(standard) analysis -> dynamic views
external analysis -> report -> static tables/graphs
Note that subsequent runs of a given external analysis would produce
separate reports. It could be useful to have each one of those reports
remain available, until they are explicitly deleted.
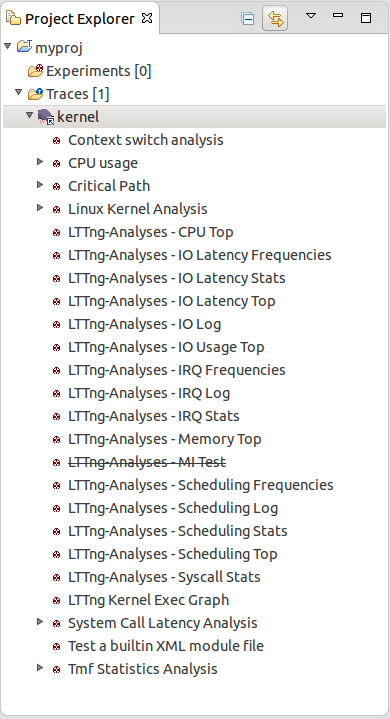
In my current prototype, I just display all available external analyses
under the trace, just like standard analyses are (see attached
screenshot). They can then be invoked by right-click on them and
choosing "Run External Analysis" from the contextual menu. The results
are displayed in non-singleton views, one per table of output of the
analysis.
This is not ideal, because it's confusing which analysis are supposed to
be run manually, and which are just there for listing their outputs. A
potential alternative would be to have a new "Run External Analysis"
option, from the context menu of the *trace*, which would open a dialog
to handle all available external analyses.
Also, we'd probably need a new name instead of "External Analysis".
These may not even be external eventually, they could be defined in
Java, shipped with Trace Compass, and be able to be called on demand by
the user.
Thoughts?


Thanks,
Alex


[1] https://github.com/lttng/lttng-analyses
Attachment:
analyses.png
Description: PNG image