Thank you everyone for your responses. I will try the options you sent me.
One of the community responders mentioned that coloring of the vehicles instead and I have done that. I like that option a lot. I was just curious if I could do it with the edges as well and see which one
I prefer for demonstrations.
One last question: I am currently coloring as I mentioned below all roadways (black), all rail (purple) and all waterways (blue). If I use the congestion coloring capability on the edges, will my edges all
change colors based on their edges speeds? I really don’t want the entire network to change color. I would like to keep the rest of the none congested network with the colors I have already chosen and just the congested edges change to a noticeable color
like dark orange or red for example. Any feedback on this?
Thanks once again for the support!
Hector A. Martinez, P.E.
MITRE | Solving Problems
for a Safer World (R)

813.207.5365
From: Manohara C V <manohara.cv@xxxxxxxxxxxxxxxxxxx>
Sent: Friday, June 14, 2024 1:18 AM
To: Sumo project User discussions <sumo-user@xxxxxxxxxxx>
Cc: Hector A Martinez <hmartinez@xxxxxxxxx>
Subject: Re: [sumo-user] [EXT] Re: Request for Assistance with Congestion Visualization in SUMO
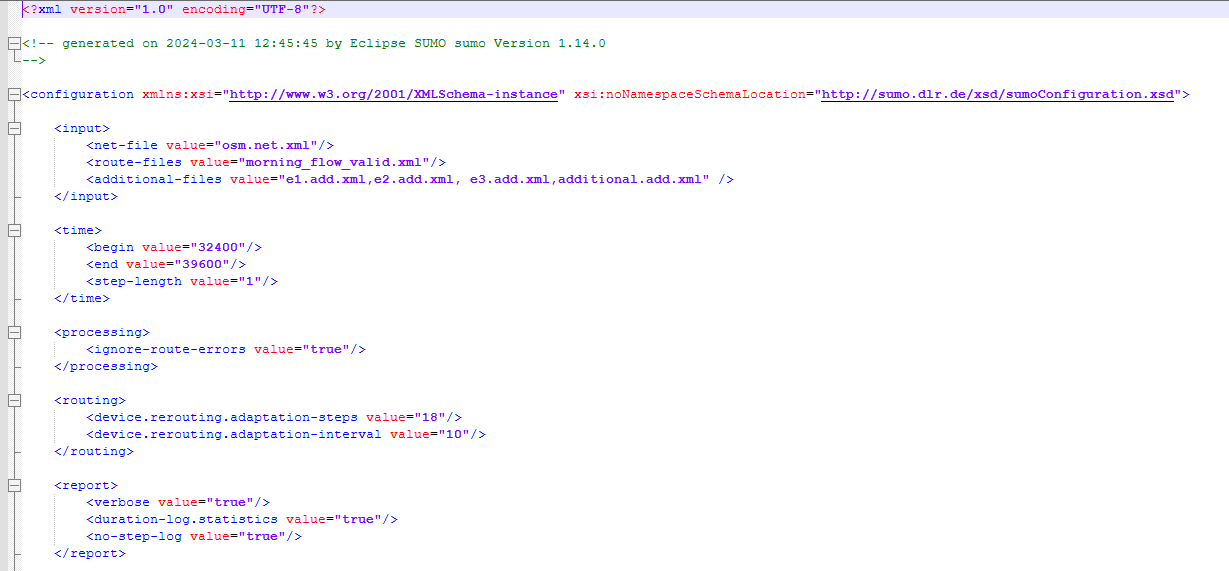
Dear Hector, I got what you are asking, steps to follow for congestion visualization is to select the streets visualization by live edge data and sumo configuration
should be provided with additional dump file. Sumo config looks like this And
I got what you are asking, steps to follow for congestion visualization is to select the streets visualization by live edge data and sumo configuration should be provided with additional
dump file.
Sumo config looks like this
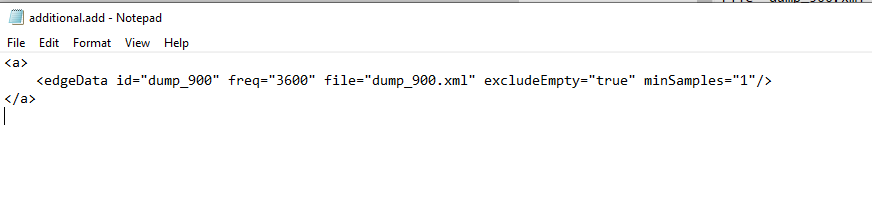
And additional file like this
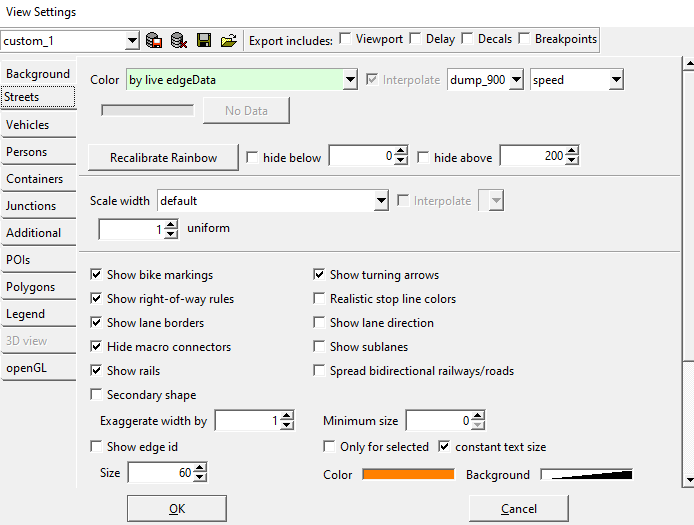
And you need to visualize the simulation by selecting street and live edge data by,
This can be done. But I have different question ,
After training ml model for congestion identification , I need to
highlight the edges using traci. Only edges with congestion , for that I'm not getting the solution. Please provide the solution if anyone knows.
Thanks & Regards,
Manohara C V
AI Services | ADS
External: This email originated
from outside of the organization. Do not click links or open attachments unless you recognize the sender and know the content is safe.
Good evening sumo community,
I want to follow up on this email that another member of the community sent regarding congestion visualization. When I try to set the coloring scheme to show congestion I am not successful at it.
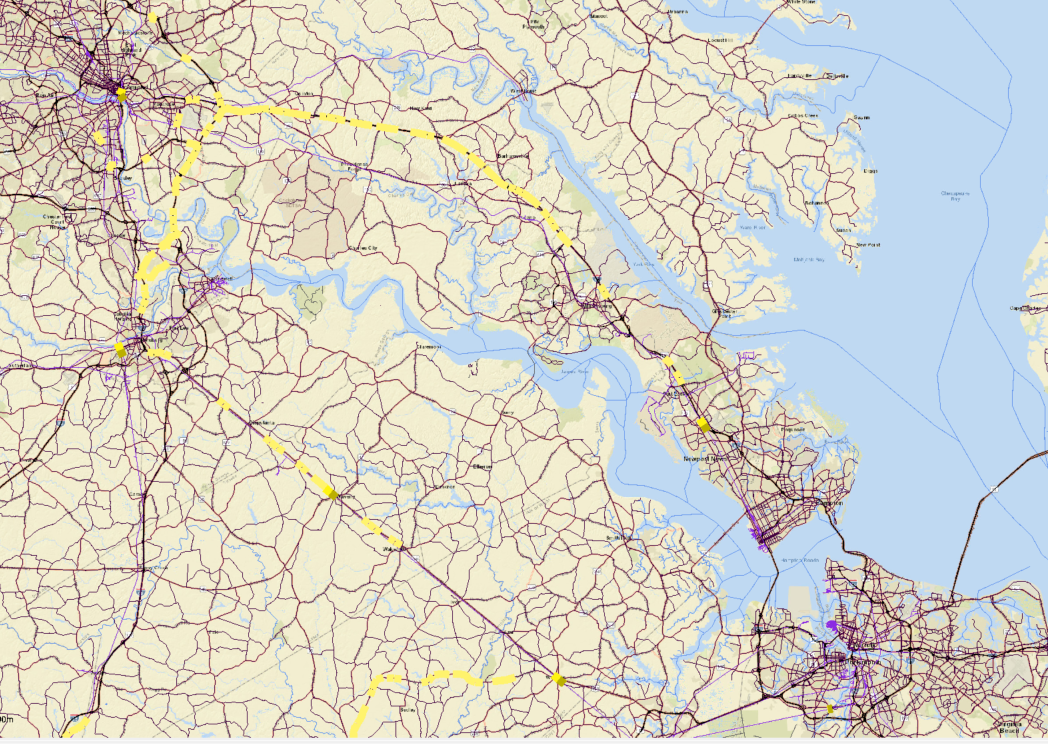
Here is my network at initial set up:
Roadways: Black
Rail: Purple
Waterways: Blue
When I follow the Coloring by data instructions online (https://sumo.dlr.de/docs/sumo-gui.html#coloring_by_data) and I go to color by
edgeData - Speed, this is what I get:
All of my street coloring goes away. I must be missing a step. Any help in this regard would be greatly appreciated.
Thanks,
Hector A. Martinez, P.E.
MITRE | Solving Problems for a Safer World (R)
813.207.5365
If you need your congestion level averaged over some time, see https: //sumo. dlr. de/docs/sumo-gui. html#visualizing_edge-related_data
(a useful edgeData value for congestion is "relativeSpeed"). Note, that you can change the coloring
If the current (un-averaged) network state is sufficient, you can set edge coloring to "by average relative speed".
I hope this message finds you well. My name is Manohara c v, and I am currently working on a project involving traffic congestion visualization using SUMO (Simulation of Urban MObility).
I have successfully identified the congested road segments within the simulation. However, I am encountering difficulties with highlighting these road segments using the required color to visualize the congestion
effectively. Despite reviewing the SUMO documentation and available resources, I am unsure how to implement this feature correctly.
Could you please provide guidance or resources on how to highlight specific road segments with different colors in SUMO based on congestion levels? Any examples or detailed instructions would be highly appreciated.
Thank you very much for your time and assistance. I look forward to your response.
Manohara C V
AI Services | ADS

_______________________________________________
sumo-user mailing list
sumo-user@xxxxxxxxxxx
To unsubscribe from this list, visit
https://www.eclipse.org/mailman/listinfo/sumo-user