
[Date Prev][Date Next][Thread Prev][Thread Next][Date Index][Thread Index] [List Home]
Re: [sumo-user] [EXT] Re: Request for Assistance with Congestion Visualization in SUMO

You can set edgeColoring to "by param (numerical, streetwise)" , set up a coloring scheme that maps numbers to colors and then use traci.edge.setParameter to supply the data.
(make sure you store the coloring scheme to a gui settings file so you don't need to set up colors again later).


Am Fr., 14. Juni 2024 um 07:27 Uhr schrieb Manohara C V via sumo-user <sumo-user@xxxxxxxxxxx>:
Dear Hector,

I got what you are asking, steps to follow for congestion visualization is to select the streets visualization by live edge data and sumo configuration should be provided with additional dump file.

Sumo config looks like this

And additional file like this
And you need to visualize the simulation by selecting  street and live edge data by,

This can be done. But I have different question ,

After training ml model for congestion identification , I need to highlight the edges using traci. Only edges with  congestion , for that I'm not getting the solution. Please provide the solution if anyone knows.

Thanks & Regards,

Manohara C V

AI Services | ADS


From: sumo-user <sumo-user-bounces@xxxxxxxxxxx> on behalf of Hector A Martinez via sumo-user <sumo-user@xxxxxxxxxxx>
Sent: 14 June 2024 01:18
To: Sumo project User discussions <sumo-user@xxxxxxxxxxx>
Cc: Hector A Martinez <hmartinez@xxxxxxxxx>
Subject: Re: [sumo-user] [EXT] Re: Request for Assistance with Congestion Visualization in SUMO
 

External: This email originated from outside of the organization. Do not click links or open attachments unless you recognize the sender and know the content is safe.

Good evening sumo community,


I want to follow up on this email that another member of the community sent regarding congestion visualization.  When I try to set the coloring scheme to show congestion I am not successful at it.


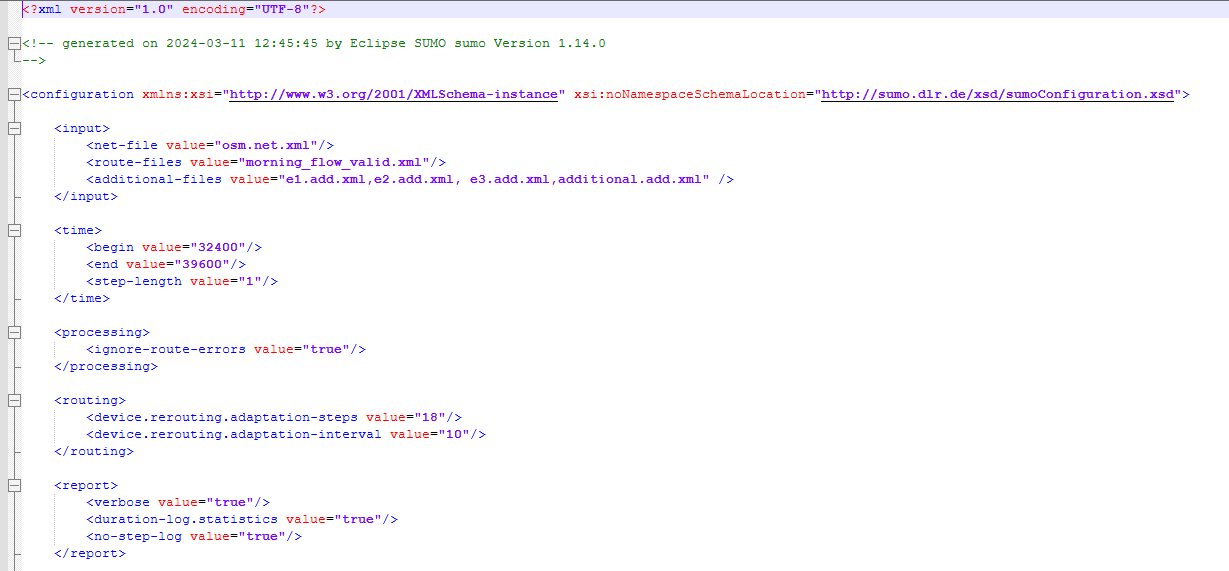
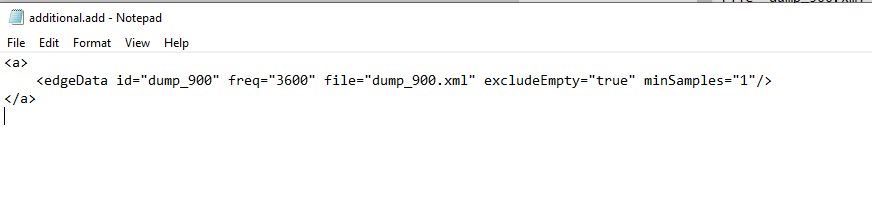
Here is my network at initial set up:

Roadways: Black

Rail: Purple

Waterways: Blue


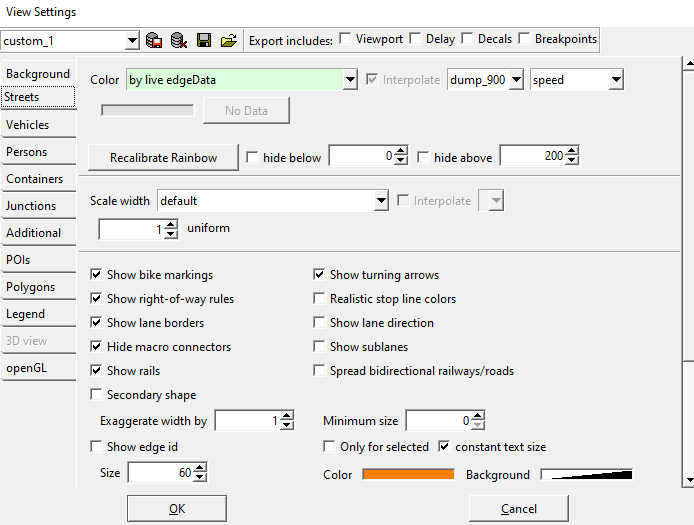
When I follow the Coloring by data instructions online (https://sumo.dlr.de/docs/sumo-gui.html#coloring_by_data) and I go to color by 
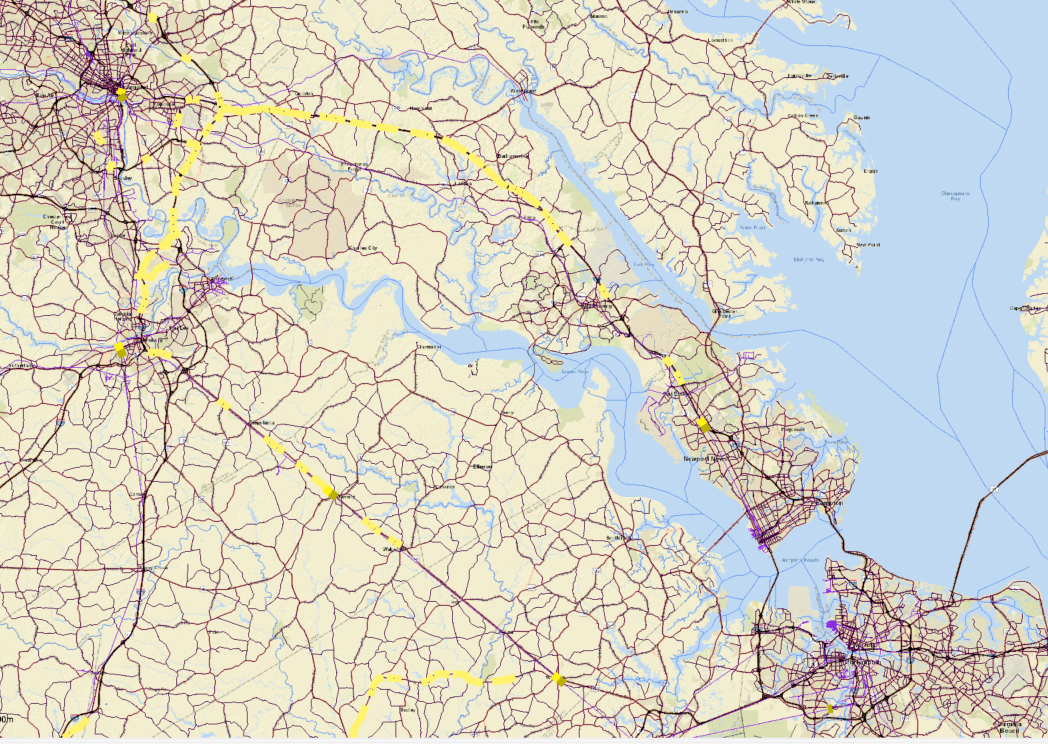
edgeData - Speed, this is what I get:


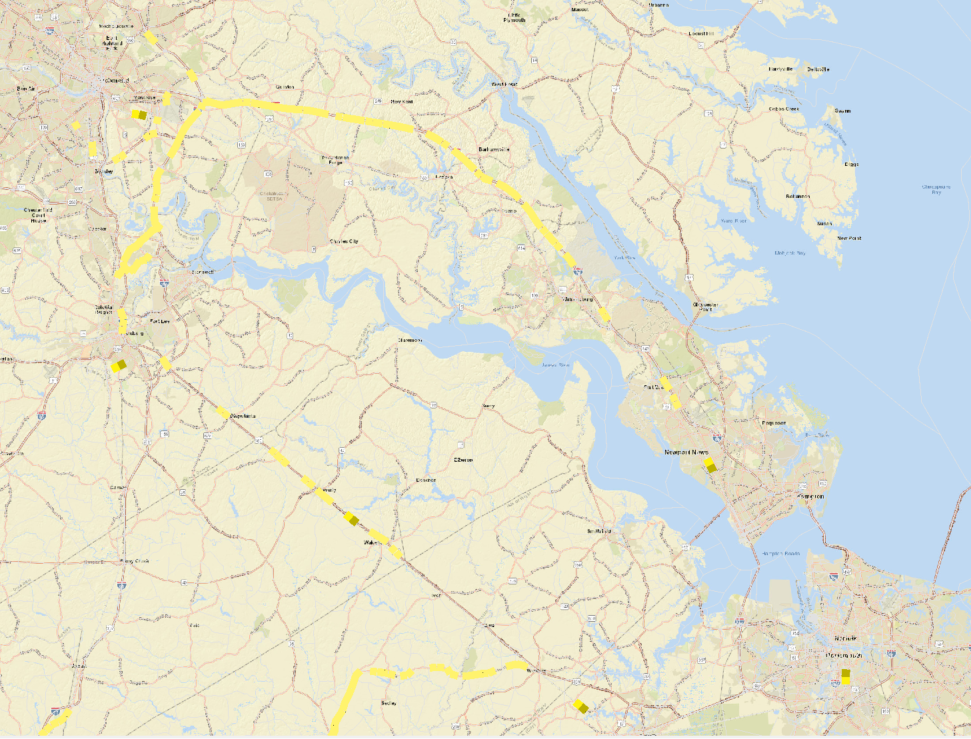
All of my street coloring goes away.  I must be missing a step.  Any help in this regard would be greatly appreciated.


Thanks,


Hector A. Martinez, P.E.

MITRE | Solving Problems for a Safer World (R)

813.207.5365


From: sumo-user <sumo-user-bounces@xxxxxxxxxxx> On Behalf Of Jakob Erdmann via sumo-user
Sent: Tuesday, June 11, 2024 7:07 AM
To: Sumo project User discussions <sumo-user@xxxxxxxxxxx>
Cc: Jakob Erdmann <namdre.sumo@xxxxxxxxx>
Subject: [EXT] Re: [sumo-user] Request for Assistance with Congestion Visualization in SUMO


If you need your congestion level averaged over some time, see https://sumo.dlr.de/docs/sumo-gui.html#visualizing_edge-related_data (a useful edgeData value for congestion is "relativeSpeed"). Note, that you can change the coloring

If you need your congestion level averaged over some time, see https://sumo.dlr.de/docs/sumo-gui.html#visualizing_edge-related_data (a useful edgeData value for congestion is "relativeSpeed"). Note, that you can change the coloring scale according to your desired thresholds using the add/remove buttons (or automatically: https://sumo.dlr.de/docs/sumo-gui.html#coloring_by_data)

If the current (un-averaged) network state is sufficient, you can set edge coloring to "by average relative speed".


Am Di., 11. Juni 2024 um 12:53 Uhr schrieb Manohara C V via sumo-user <sumo-user@xxxxxxxxxxx>:

Dear Team,

I hope this message finds you well. My name is Manohara c v, and I am currently working on a project involving traffic congestion visualization using SUMO (Simulation of Urban MObility).

I have successfully identified the congested road segments within the simulation. However, I am encountering difficulties with highlighting these road segments using the required color to visualize the congestion effectively. Despite reviewing the SUMO documentation and available resources, I am unsure how to implement this feature correctly.

Could you please provide guidance or resources on how to highlight specific road segments with different colors in SUMO based on congestion levels? Any examples or detailed instructions would be highly appreciated.

Thank you very much for your time and assistance. I look forward to your response.


Thanks & Regards,

Manohara C V

AI Services | ADS

image

_______________________________________________
sumo-user mailing list
sumo-user@xxxxxxxxxxx
To unsubscribe from this list, visit https://www.eclipse.org/mailman/listinfo/sumo-user

_______________________________________________
sumo-user mailing list
sumo-user@xxxxxxxxxxx
To unsubscribe from this list, visit https://www.eclipse.org/mailman/listinfo/sumo-user

Back to the top