[Date Prev][Date Next][Thread Prev][Thread Next][Date Index][Thread Index] [List Home]
Re: [sumo-user] Air Pollution HeatMap

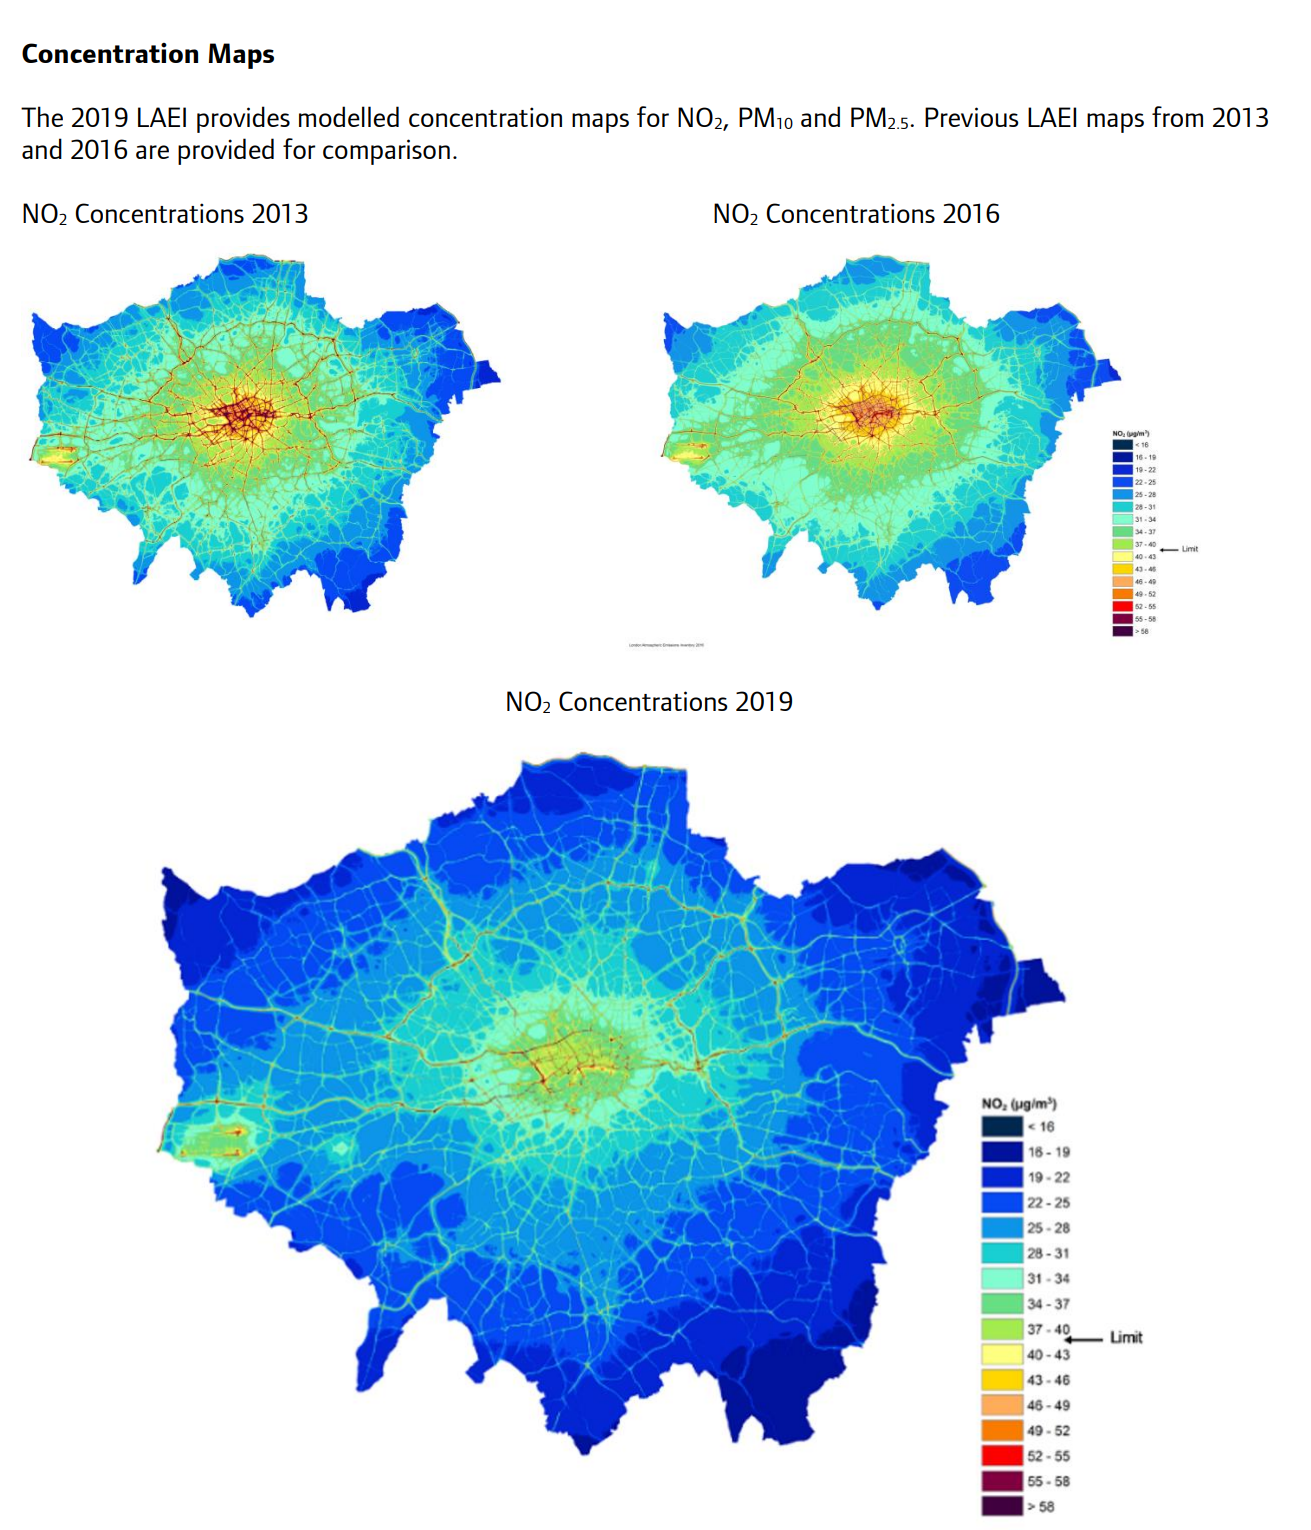
I was more looking for a heatmap like this one from London. For that, I was thinking about the --emission-output which gives (long,lat) in the output, and then I can make some spatio-temporal analysis for the aggregation over the area. I lack the GIS expertise for data aggregation though. The idea is to compare the values from simulation with empirical data measured by portable devices, that's why aggregation along edges or lanes is not the best indicator.
image.png

On Fri, Dec 24, 2021 at 12:08 AM Jakob Erdmann <namdre.sumo@xxxxxxxxx> wrote:
To increase the spatial resolution, you could cut up your network into shorter edges using netconvert --geometry.max-segment-length 100 --geometry.split

Am Do., 23. Dez. 2021 um 15:47 Uhr schrieb Sasan Amini <aminissn@xxxxxxxxx>:
Dear all,
Has anyone experience with generating air pollution concentration maps from SUMO vehicle trajectory outputs? Generating PHEM traces is one thing, but generating a heatmap of the road network is what I am looking for.
Any suggestions of previous case studies, tools, or SUMO user conference papers are appreciated.

Best,
Sasan
_______________________________________________
sumo-user mailing list
sumo-user@xxxxxxxxxxx
To unsubscribe from this list, visit https://www.eclipse.org/mailman/listinfo/sumo-user
_______________________________________________
sumo-user mailing list
sumo-user@xxxxxxxxxxx
To unsubscribe from this list, visit https://www.eclipse.org/mailman/listinfo/sumo-user

Back to the top