[
Date Prev][
Date Next][
Thread Prev][
Thread Next][
Date Index][
Thread Index]
[
List Home]
|
[sumo-user] Fundamental diagram
|
Hello,
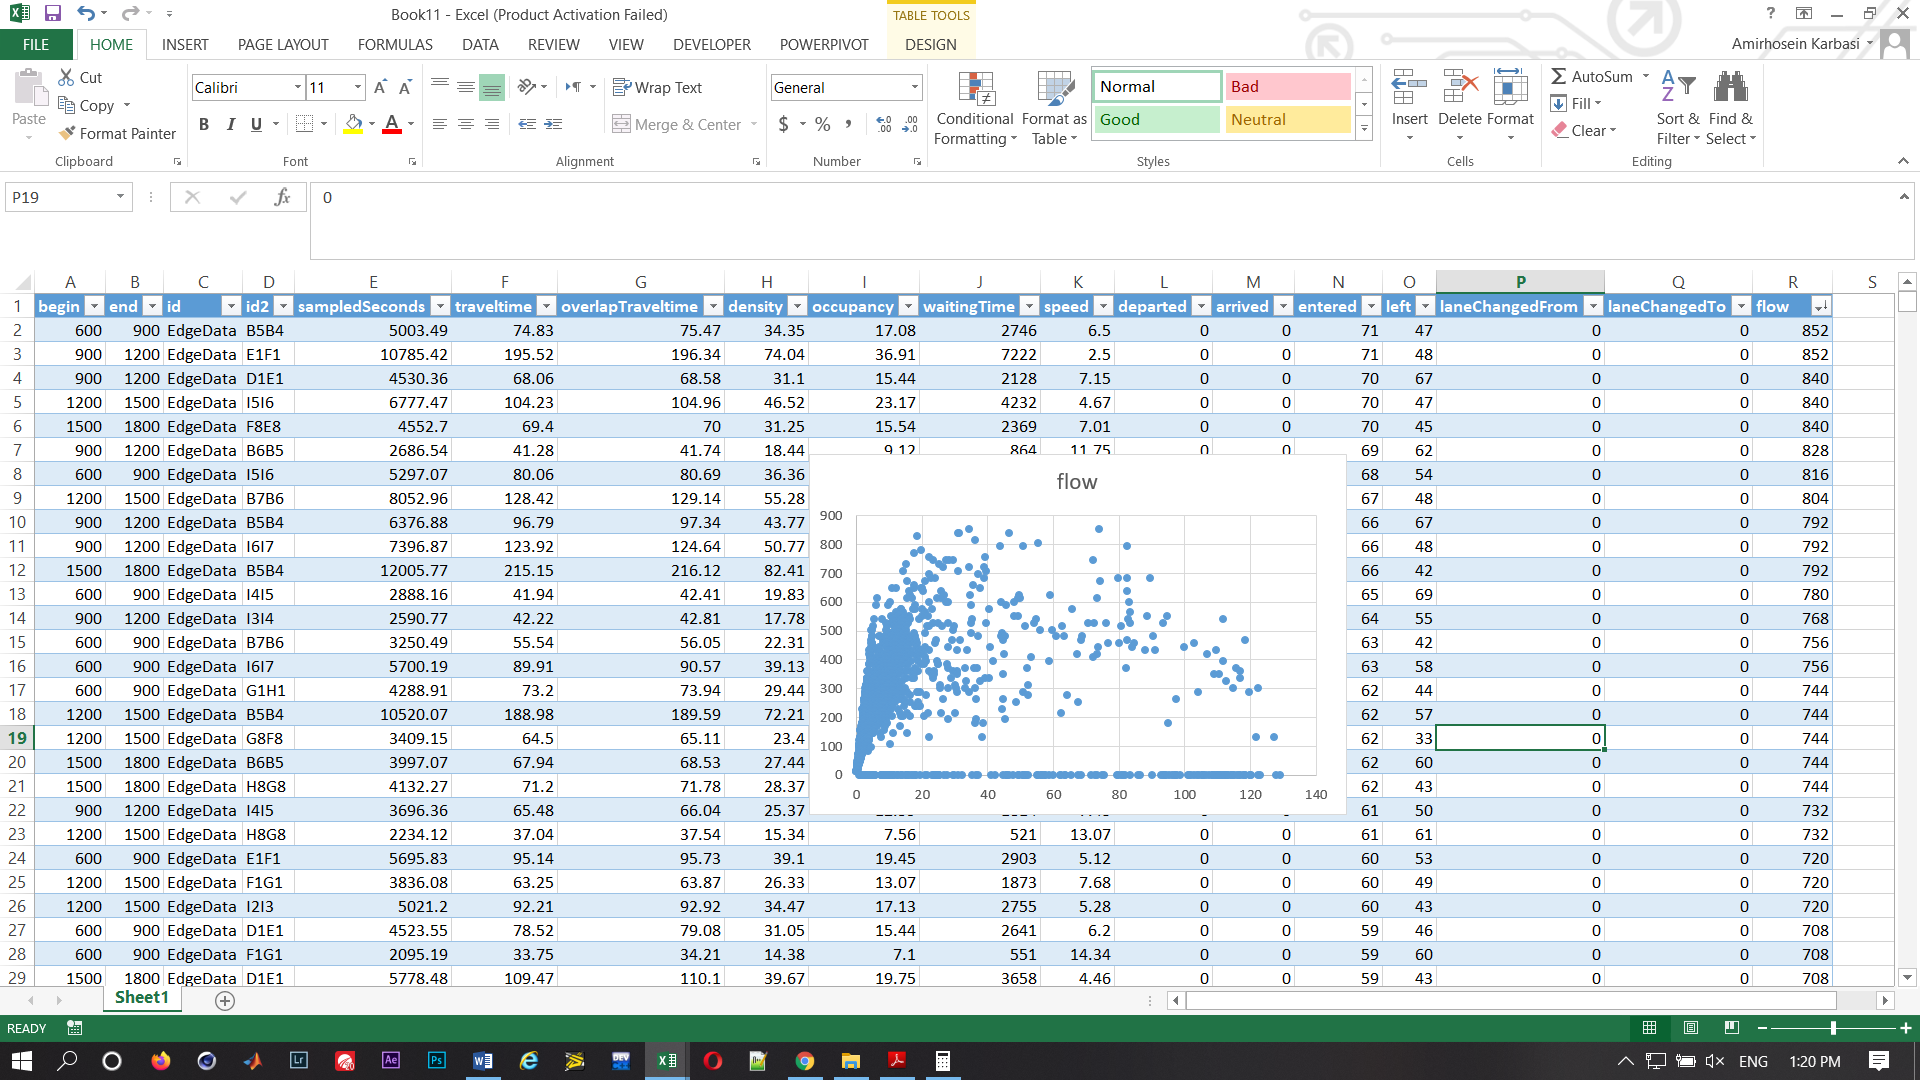
I want to draw a flow density diagram. My network includes 64 intersections. I ran a simulation (1800s) and use an additional file for Edge-based output (freq is 300). I drew a flow density diagram in excel based on the Edge-based output file and I calculated flow according to “entered * 3600 / freq”. Now I have 3 problems:
1. I think my flow density diagram is not similar to regular flow density diagrams. (there are a png in attach file)(Simulation time = 1800s).
2. When I drew a plot my max flow is about 852 (for 1800s, 2400s, and full-time simulation max flow is approximately 1000) and I think max flow should be bigger than 20000 for a network like this.
3. I have too many zero flows.
I saw various topics about this on the Sumo website but my problems are not solved yet.
I sent my whole files too. please say me what I am doing wrong?
Thank you so much.
Attachment:
Untitled.png
Description: PNG image
Attachment:
sumo1.rar
Description: Binary data