Well, maybe removing „--min-color-value -1000 --max-color-value 1000 --min-width-value -1000 --max-width-value 1000”?
Von: sumo-dev <sumo-dev-bounces@xxxxxxxxxxx> Im Auftrag von
Iulia Onica
Gesendet: Freitag, 3. September 2021 08:54
An: sumo developer discussions <sumo-dev@xxxxxxxxxxx>
Betreff: Re: [sumo-dev] plot_net_dump visualization
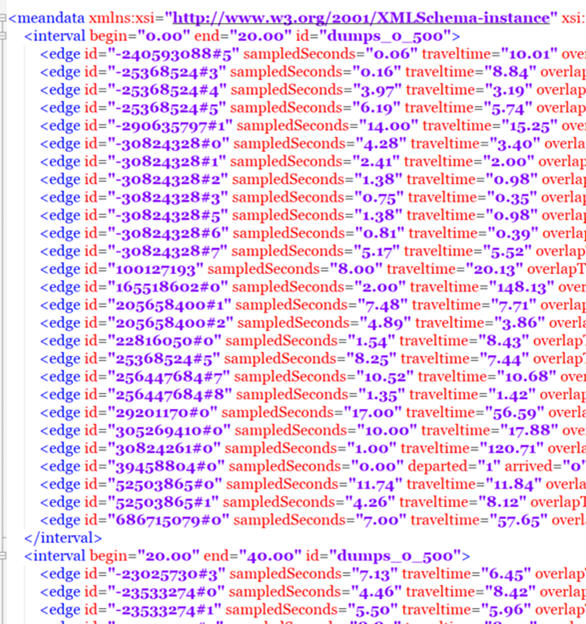
<interval begin="0.00" end="20.00" id="dumps_0_10000">
<edge id="-240593088#5" sampledSeconds="0.06" traveltime="10.01" overlapTraveltime="10.94" density="0.06" laneDensity="0.02" occupancy="0.00" waitingTime="0.00" timeLoss="0.04"
speed="5.39" departed="0" arrived="0" entered="1" left="0" laneChangedFrom="1" laneChangedTo="1"/>
<edge id="-25368524#3" sampledSeconds="0.16" traveltime="8.84" overlapTraveltime="9.62" density="0.14" laneDensity="0.07" occupancy="0.00" waitingTime="0.00" timeLoss="0.07" speed="6.43" departed="0" arrived="0" entered="1" left="0"
laneChangedFrom="0" laneChangedTo="0"/>
<edge id="-25368524#4" sampledSeconds="3.97" traveltime="3.19" overlapTraveltime="3.97" density="7.53" laneDensity="3.77" occupancy="1.59" waitingTime="0.00" timeLoss="1.31" speed="7.90" departed="0" arrived="0" entered="1" left="1"
laneChangedFrom="1" laneChangedTo="1"/>
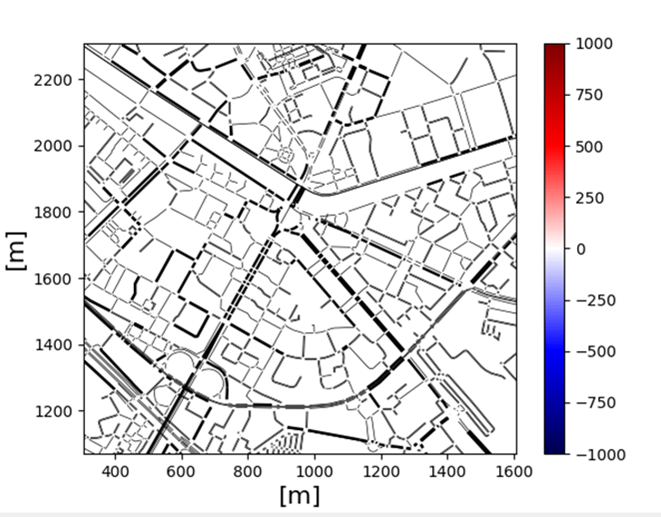
I have tried also with sampledSeconds,traveltime and still did not work:
python SUMO_HOME/tools/visualization/plot_net_dump.py -v -n pr.net.xml
--measures sampledSeconds,traveltime --xlabel [m] --ylabel [m] --default-width 0.5 -i
dumps_0_10000.xml,dumps_0_10000.xml --xlim 300,1500 --ylim 1100,2300 --min-color-value -1000 --max-color-value 1000 --min-width-value -1000 --max-width-value 1000 --colormap seismic
Any more ideas :( ?
Hello there,
You pass “--measures speed,entered” as measures to show, but they are not included in your files. Use “--measures sampledSeconds,traveltime” instead.
Sincerely,
Daniel
Von: sumo-dev <sumo-dev-bounces@xxxxxxxxxxx>
Im Auftrag von Jakob Erdmann
Gesendet: Freitag, 3. September 2021 08:36
An: sumo developer discussions <sumo-dev@xxxxxxxxxxx>
Betreff: Re: [sumo-dev] plot_net_dump visualization
Both files passed to the plotting script must cover the same time intervals. The first file is used for the colors and the second for the width (the same file may be used for both
parts).
By passing two files with different time ranges to the script, no color and width data with the same timestamps are found.
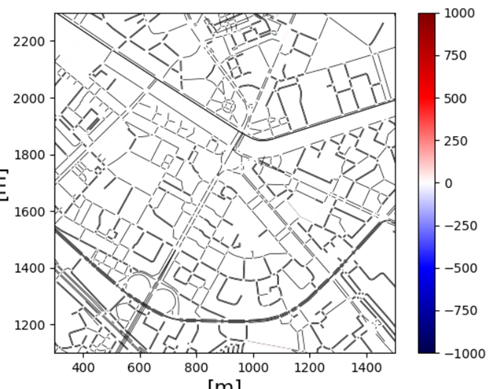
It is not like there is no plot at all. By removing the limits it gets zoomed out.
The problem is that it is not colored at all.
Also, the path I am using looks looks this:
python D:/prog/tools/visualization/plot_net_dump.py
Do you have any idea what might be?
Possibly, you are plotting an empty spatial range. Try running your command without --xlim and --ylim. Also, the tool is located at SUMO_HOME/tools/visualization. If you put it
someplace else it may not find it's libraries.
I was trying to get a plot using plot_net_dump python script but it seems like nothing is plotted.
I used the following command:
python .SUMO HOME/plot_net_dump.py -v -n pr.net.xml --measures speed,entered --xlabel [m] --ylabel [m] --default-width 0.5 -i dumps_0_500.xml,dumps_500_1000.xml --xlim 300,1500
--ylim 1100,2300 --min-color-value -1000 --max-color-value 1000 --min-width-value -1000 --max-width-value 1000 --colormap seismic
And nothing gets colored on the map. I ran the simulation with a random traffic using random_trips.py and with this code for the additional file:
<edgeData id="dumps_0_500" freq="20" file="dumps_0_500.xml" excludeEmpty="true" begin="0" end="500"/>
<edgeData id="dumps_500_1000" freq="20" file="dumps_500_1000.xml" excludeEmpty="true" begin="500" end="1000"/>
The output file looks like this:
Do you know which may be the problem?
_______________________________________________
sumo-dev mailing list
sumo-dev@xxxxxxxxxxx
To unsubscribe from this list, visit
https://www.eclipse.org/mailman/listinfo/sumo-dev
_______________________________________________
sumo-dev mailing list
sumo-dev@xxxxxxxxxxx
To unsubscribe from this list, visit
https://www.eclipse.org/mailman/listinfo/sumo-dev
--
sumo-dev mailing list
sumo-dev@xxxxxxxxxxx
To unsubscribe from this list, visit
https://www.eclipse.org/mailman/listinfo/sumo-dev
_______________________________________________
sumo-dev mailing list
sumo-dev@xxxxxxxxxxx
To unsubscribe from this list, visit
https://www.eclipse.org/mailman/listinfo/sumo-dev
|