[
Date Prev][
Date Next][
Thread Prev][
Thread Next][
Date Index][
Thread Index]
[
List Home]
|
[incquery-dev] debugger tooling
|
Hi all
I have started to deal with the IncQuery Debugger Support:
https://bugs.eclipse.org/bugs/show_bug.cgi?id=405556
Initially I just wanted to try out the Debugger API but I ended up
implementing an "EMF-IncQuery Variables View" which is similar to the
Variables View in Eclipse.
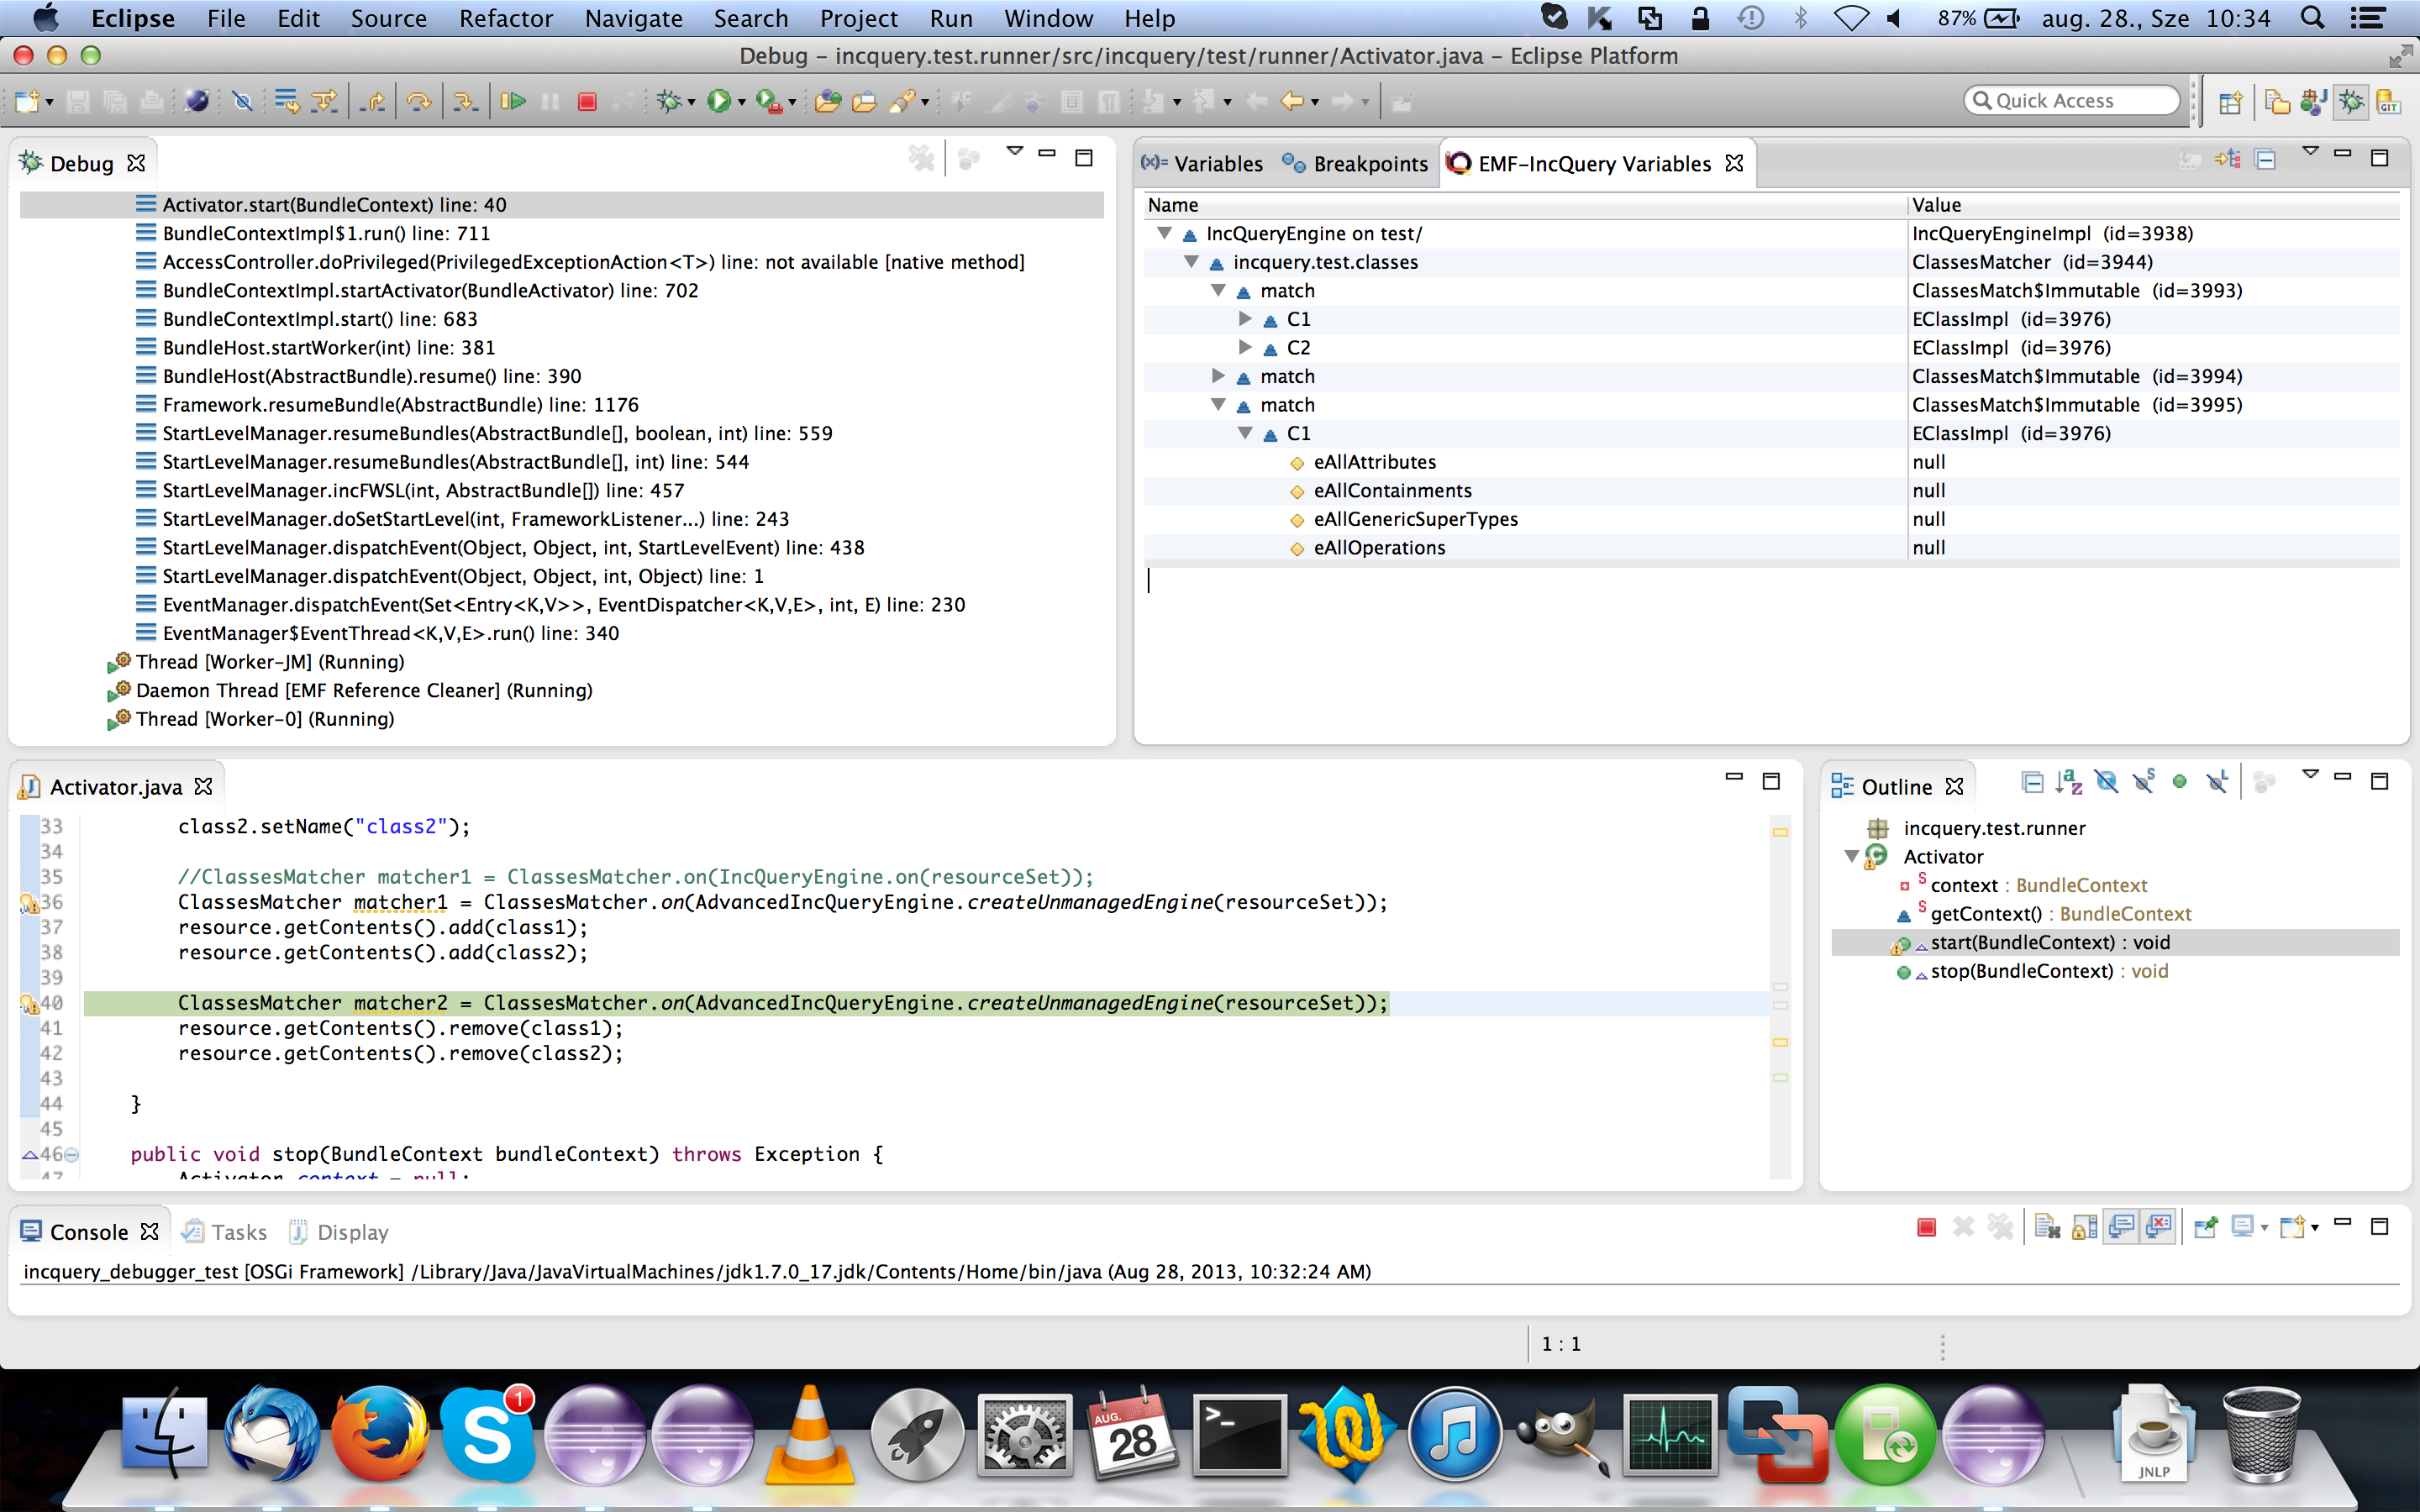
The attached screenshot was taken during the debugging of an OSGi test
application with pattern matching.
Here you can see on the top level of the tree hierarchy the
IncQueryEngine instances in the target JVM. Note that this View is
usually one level below the target Eclipse instance, this case is
special in the sense, that the debugger and the target app run "in the
same Eclipse instance" (of course in different JVMs). This view would
briefly correspond to point 2 in the issue description.
Nevertheless, I do not really understand what does it mean to "point my
debugger" (@Gaben).
These things are accessible through the Debugger API, basically I can
retrieve the ClassLoader object (a special one, these things are under
the com.sun.jdi package) from the stack frame when the view is notified
that the application has stopped at a breakpoint. Then I can get all the
instances of the given class (engines) and access attributes of these
instances similarly to Java Reflection. I can even call methods in the
target VM with the Debugger API, but at the moment it is a bit
problematic. Consider the following snippet:
    Method method = null;
        try {
List<Method> methods =
ref.referenceType().methodsByName(methodName);
            for (Method m : methods) {
                if (m.arguments().isEmpty()) {
                    method = m;
                    break;
                }
            }
        }
        catch (AbsentInformationException e) {
            //ignore
        }
        if (method != null) {
            while (result == null && t < 10) {
                try {
result = ref.invokeMethod(threadReference, method,
new ArrayList<Value>(), 0);
                } catch (Exception e) {
                    result = null;
                }
                t++;
            }
        }

The classes here are from the com.sun.jdi package.
This method body tries to call the given method (parameterless!) on the
given ObjectReference instance. However, sometimes I get an
InvalidThreadStateException during the invocation.
The JavaDoc says that this Exception is thrown when the thread has not
been suspended by an event
(http://download.java.net/jdk8/docs/jdk/api/jpda/jdi/com/sun/jdi/ObjectReference.html#invokeMethod%28com.sun.jdi.ThreadReference,%20com.sun.jdi.Method,%20java.util.List,%20int%29).
What I have found out (and is surprising) is that consecutive
invocations (2-3 tries) usually (99% of the time) succeed. This method
implementation with the while loop may seem strange but it works most of
the time, I just wanted to restrict the possibility of an infinite loop.
This whole method invocation is necessary because I cannot get the
matches of a matcher from an instance field.
It would be great if someone knowledgeable could help me out with this
issue. I tried to search for similar problems but haven't really found
anything. I also searched for the implementation of the debugger itself
(which executes such method invocations in the target VM) to be able to
see what is happening when the Exception is thrown. Again, no luck :( I
could only figure out that such calls are passed as messages and the
protocol itself is described here
http://docs.oracle.com/javase/1.5.0/docs/guide/jpda/jdwp/jdwp-protocol.html.
Cheers,
Tomi

--
Tamas Szabo
Software engineer

Tel.:   +49 711 342 191 0
Fax.:   +49 711 342 191 29
Mobil:  +49 171 565 416 9
Web:    www.itemis.de
Mail:   tamas.szabo@xxxxxxxxx
Skype:  szabta89

itemis AG
Niederlassung Süd
Meitnerstr. 10
70563 Stuttgart

Rechtlicher Hinweis:
Registergericht: Amtsgericht Dortmund HRB 20621 | Sitz der Gesellschaft:
Lünen
Vorstand: Jens Wagener (Vorsitzender) | Wolfgang Neuhaus | Dr. Georg
Pietrek | Jens Trompeter | Sebastian Neus
Aufsichtsrat: Prof. Dr. Burkhard Igel (Vorsitzender) | Stephan Grollmann
| Michael Neuhaus
Attachment:
Screen Shot 2013-08-28 at 10.34.20.png
Description: PNG image