Pawel,
There is still error in the memory browser
plugin.xml, but I excluded it from the patch.
I have spent some times testing the new
Pin&Clone feature. Below are my comments.
Variables view
-
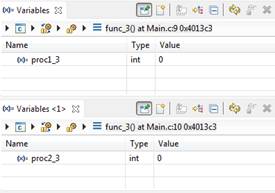
If the view is small, 1/3 of my
screen width, I can’t quickly visualize the process or thread
in the view, only the stack is visible. I have to hover the
mouse over the breadcrumb view to see the tooltip, this makes
it difficult to find out the process or thread.

-
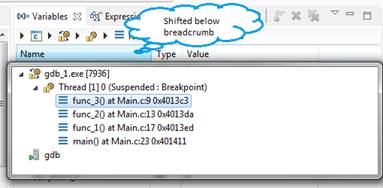
The breadcrumb drop down doesn’t
follows the breadcrumb view when the view toolbar shift.

-
When the view is pinned,
selecting the stackframe doesn’t update the view. I guess this
is due to the view is pinned to stackframe, it is different
than the current CDT implementation. I can no longer pin to a
thread (Core) and have the Variables view show different
variables for different stackframe for the same thread.
-
Restarting the workbench and
relaunch the debug sessions, the pinned views are blank. At
first, I didn’t realize that I need to reselect the debug
context in the breadcrumb view to repopulate the view.
-
When cloning a view, it uses the
current view’s pinned debug context by default. I have to
unpin it and re-pin to attach it to the current debug context,
or search the debug context in the breadcrumb view.
-
When switch the debug context, I
find it much faster to use the current debug context in the
Debug view. So, unpin the view and re-pin. Most of the time,
you are working with the debug view, and you want to pin it
the current debug context. I find myself not using the
breadcrumb view to switch between debug context.
-
When the view is at the bottom
of the workbench window, you can’t select the debug context
that is below the screen. There is no scroll bar for the
breadcrumb view.
Registers view
-
For our debugger, registers are
global and it doesn’t required stackframe. Some other debugger
might have register per stackframe. It doesn’t make sense for
our debugger to show the stackframe in the breadcrumb view.
Disassembly view and Memory Browser
-
There isn’t anything that I can
test at the moment, but how does the pin feature work on these
two views? It don’t make sense to be able to pin to a
stackframe, does it?
How does the Graphical debug view work with
the new Pin&Clone feature? I don’t have it setup to test
it with the new Pin&Clone feature.
Can we make the platform Pin&Clone
feature optional, where you can hide it through plugin
customizing ini file? By default CDT will use the new
Pin&Clone feature, but keep the existing implementation
and remove the action contributions from the plugin.xml file.
Vendor can enable existing CDT Pin&Clone feature through
their own plugin.xml?
I’ll do more testing when we have the
Disassembly view and the Memory Browser working.
Regards,
Patrick
Hi
Pawel,
I
tried applying the CDT patch and MemoryBrowser.java has
conflicts. I am using the latest CDT and the platform
debug side branch. Is there a specific version of CDT that
I should be using?
Regards,
Patrick
Hi All,
As mentioned on the multi-core call this morning. I'm
asking for help from CDT to validate the pin and clone
feature that I'm working on for platform (bug
145635). This version of pin and clone feature (and
there have been a few) adds a breadcrumb to the pinned view
and hopefully makes the whole workflow more usable.
I need your help to validate this feature so that I can push
it in for Kepler M5 at the end of this month.
To try it out, clone the
platform debug repo and check out the ppiech/Bug145635
branch. Import the org.eclipse.debug.ui plugin into your
workspace and finally apply a CDT patch from
bug
398012.
Thanks!
Pawel
_______________________________________________
cdt-dev mailing list
cdt-dev@xxxxxxxxxxx
https://dev.eclipse.org/mailman/listinfo/cdt-dev


