Six Reasons to Check Out the New Eclipse Theia Memory Inspector
The Eclipse Theia Memory Inspector replaces the current Theia cpp-debug-extension, and it may well deliver one of the best memory inspection experiences available in any IDE.
While our perspective may come with some bias, our goal was to create a memory viewer that’s best-in-class in as many areas as possible. With this goal in mind, we took the best memory inspection features from various IDEs and combined them with other enhancements to provide a memory widget that’s quite unique.
Here are six reasons you should give the Theia Memory Inspector a try.
1. Dynamic Memory Views
Dynamic views allow for a superior developer experience. Most memory inspector tools implement static views, which require a manual refresh each time you want to update the view as you step through code.
In contrast, the Theia Memory Inspector allows you to see changes as they occur. Memory locations that have changed from one frame to the next are highlighted (Figure 1). You can freeze a view of a particular frame by clicking the lock icon.
Figure 1: Dynamic Updates of Memory Views
You can also generate multiple memory views to compare memory at different times or memory from different regions. This is particularly helpful when you’re copying or moving data from one region to another and need to verify the operation is occurring as it should.
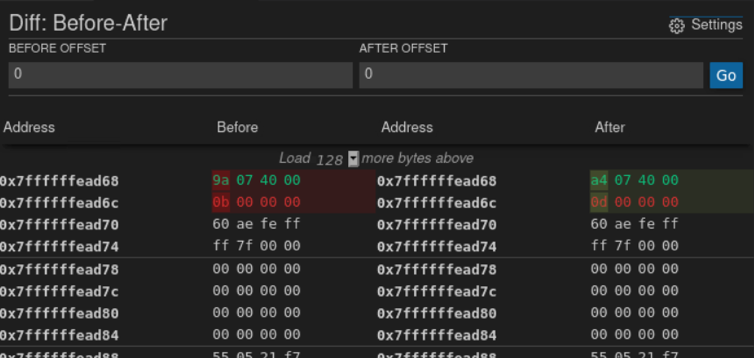
To make it more convenient to visually compare memory, the Memory Inspector provides a memory diff widget. When you create two memory views and choose the compare option, the widget aligns the views side by side and highlights the differences, similar to a diff view in Git (Figure 2).
Figure 2: Diffing Memory
2. Viewing Options and Accessibility
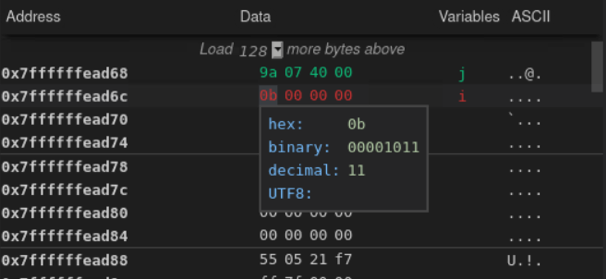
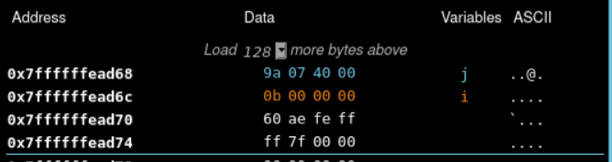
The Memory Inspector displays bytes in hex format, but also provides the option to view memory in ASCII format. Hovering over a specific value reveals even more representations including binary, decimal, and even UTF8 (if available). Variables in scope are colored so it’s easier to distinguish what you’re looking at. These visual markers greatly improve readability (Figure 3).
Figure 3: Different Representations of Memory
To support developers who are color-blind, we added a high contrast theme. If you’re using a high contrast theme in Theia, you’ll see contrasting colors when looking at the variables in the Memory Inspector (Figure 4).
Figure 4: High Contrast Theme
3. Fast and Easy Setup With a Simplified Configuration
Our primary goal is to help developers get into the memory as quickly and easily as possible. As a result, the Memory Inspector provides multiple entry points to directly access a memory view, including right-clicking a variable in the debugger pane and explicitly entering an address or expression in the Memory Inspector’s input field.
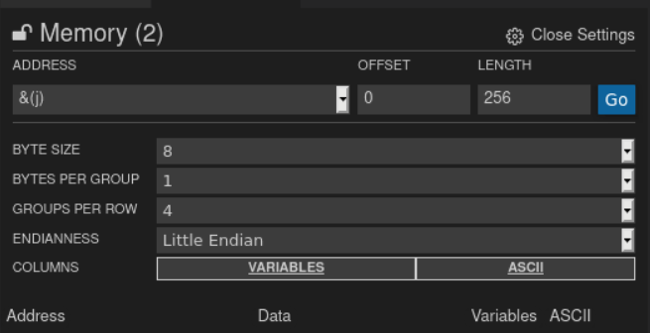
To further simplify usability, the Memory Inspector provides a minimalist interface for configuring basic viewing parameters, as well as a more advanced menu for specific configuration, such as byte size and endianness (Figure 5).
Figure 5: Memory View Configuration
4. Dockable Panels and Flexible Views
Modern IDEs, such as those built using Theia, provide a minimalist user interface (UI) rather than heavy toolbars and cluttered UI elements. We’ve followed this paradigm in the Memory Inspector UI (Figure 6).
Figure 6: Moving Memory Views Around
To take maximum advantage of horizontal screen real estate, the Memory Inspector consists of a dockable tab bar that is displayed in the right-most column of the IDE by default. If you have multiple memory views open, you can “tear” each one from the panel, resize it, and place it where it’s most convenient in your screen layout. If you’re reviewing a large memory chunk, you likely need a large memory inspection panel. At other times, you may just want to tuck the panel into a corner of your screen.
The flexibility to tailor the number and size of individual Memory Inspector views comes from Theia. We simply applied it to our widget. This point is worth emphasizing because many IDEs have rigid layouts with predefined areas to host certain types of views. There are often limits to where you can place a view. Theia frees you to place a memory view anywhere on the screen.
5. Easy Functionality Overriding
Another important capability the Memory Inspector inherits from Theia is the ability to override almost anything.
For example, it’s quite easy to extend the Memory Inspector to work with a debug adapter other than the CDT GDB tooling it’s paired with now. It’s simply a matter of extending and modifying one class in the Memory Inspector code.
6. A Drop-In Extension for Eclipse Theia-Based IDEs
Anyone building a Theia-based IDE and using a debugger that reads memory can add the Memory Inspector as a dependency and it will be available in the IDE.
Bringing the Memory Inspector, with all of its features for viewing memory, into Theia-based IDEs for embedded software development is a particularly powerful combination.
Try the Memory Inspector and Provide Feedback
We believe the Eclipse Theia Memory Inspector offers a lot of potential to developers, and we’re eager to get feedback about concrete use cases.
To see the pull request and documentation for the Memory Inspector, go to GitHub. To report bugs and add feature requests, use the Issues page.
We also welcome developers to join us in enhancing the Memory Inspector, especially those with a particular feature they would like to add.
For additional insight into the Memory Inspector and its features, read our blog post.
About the Authors