Maritime Location Intelligence with exactEarth data and GeoMesa
Location Intelligence at Sea and at Scale
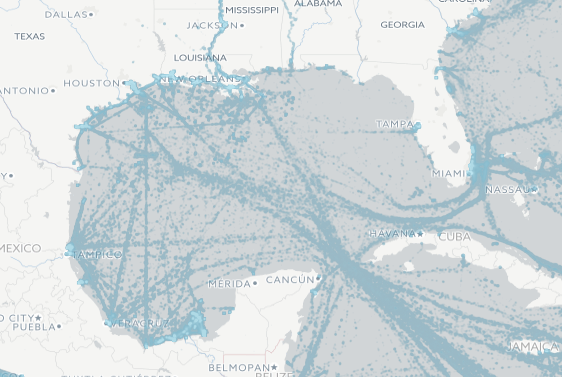
The data services company exactEarth uses a constellation of satellites in space to collect more than 25 million Automatic Identification System (AIS) messages per day. This volume continues to increase as more of their 60+ exactView Real-Time powered by Harris satellites come online, because maritime vessels use the AIS system to report their position, identity, and additional navigation information. From this rich source of data about maritime activity, we can derive insights on shipping tonnage for capital and energy markets, the impact of weather on insurance markets and commercial supply chains, fuel consumption for clean energy applications, and much more.
That’s where the Eclipse Locationtech working group’s GeoMesa comes in. GeoMesa is a robust cloud-native toolchain for processing a data stream in near-real time, visualizing that stream, storing it in a ‘big data’ solution, and analyzing it. For example, GeoMesa can generate heat maps of AIS traffic:
LocationTech GeoMesa
The Eclipse Newsletter article GeoMesa: Scaling up Geospatial Analysis gave an overview of GeoMesa as an open-source spatio-temporal database backed by popular Hadoop-based databases for back-end storage. These databases let GeoMesa scale out horizontally to store billions and even trillions of spatial records. To ease developer adoption and use, GeoMesa integrates projects in the broader geospatial Java ecosystem such as GeoTools and GeoServer.
GeoMesa can also take advantage of Apache Spark, a computing framework that makes it easier to build advanced analytics. While using Spark requires no Hadoop infrastructure, it has become popular on that platform because it makes it so much easier to do custom analytics without worrying about the Map and Reduce steps that often had to be hand-coded in early Hadoop application development. Spark offers additional capabilities using optional modules such as the MLib machine learning library, the GraphX graph processing library, a streaming library, and the Spark SQL library.
The Spark SQL library provides a way to store data in table-like structures called DataFrames that can then be queried with SQL. This lets people take advantage of new classes of big data with a straightforward, interpreted language that many of these people have known for years.
While SQL can do math with retrieved data to calculate figures such as sums, averages, and differences among retrieved values, SQL implementations usually offer no spatial data types and functions. So, while you might have the right data to help you determine where your next retail outlet should be, vanilla SQL lacks the calculation horsepower that you would need to calculate the distance and area figures that make the best use of that data. Add-in packages for relational databases such as the PostGIS module for the PostgreSQL database and Oracle Spatial and Graph extend the SQL language for use with those particular databases, but until recently no such extensions existed for Spark SQL.
GeoMesa and Spark SQL
To address this lack of geospatial support in Spark SQL, the GeoMesa team added extensions to support geospatial data types such as points, linestrings, and polygons. To work with these new types, the team used LocationTech JTS to implement a long list of new geospatial functions that you can now call from Spark SQL when working with GeoMesa. GeoMesa also hooks into Spark’s Catalyst query optimizer to rewrite queries and push spatial filtering down to the underlying distributed database, making execution more efficient.
Users and analysts can access the power of Spark SQL by writing SQL, Scala, or Python to execute their queries. This brings this ability to perform complex geospatial analytics tasks to a broader user base. Using these with Notebook servers such as Apache Zeppelin makes it easier to rapidly prototype analytics and powerful visualizations.
Exploring Hurricane Harvey
To demonstrate the spatial SQL extensions, let’s use them to learn about how Hurricane Harvey affected the supply chain of vessels visiting ports in the Gulf of Mexico.
First, we use GeoMesa to load position reports for the region and the time period (August 25th to September 3rd, 2017) into a Spark dataframe named ‘vessels’. The first query on this dataframe will find which vessels are in which ports:
SELECT vessel_id, port_name, vessel_type
FROM ports JOIN vessels
ON st_contains(port_geometry, vessel_position)
AS vesselsJoinPorts
Without GeoMesa’s extensions, the port_geometry and vessel_position spatial columns and the st_contains spatial function would be unavailable. GeoMesa also offers options to partition data spatially and to cache dataframes in memory to accelerate such spatial joins.
Next, we can aggregate statistics for each port and for each vessel type:
SELECT first(port_name), first(vessel_type), count(distinct vessel_id) FROM vesselsJoinPorts
GROUP BY port_name, vessel_type
Visualizing before, during and after Harvey
Repeating similar queries with date ranges before, during and after the hurricane, we can compute statistics that analyze the hurricane’s effect on shipping. Within a Zeppelin Notebook the AIS data can be queried and aggregated using Spark SQL and also natively plotted in the same environment. This makes it possible to generate figures like this one:
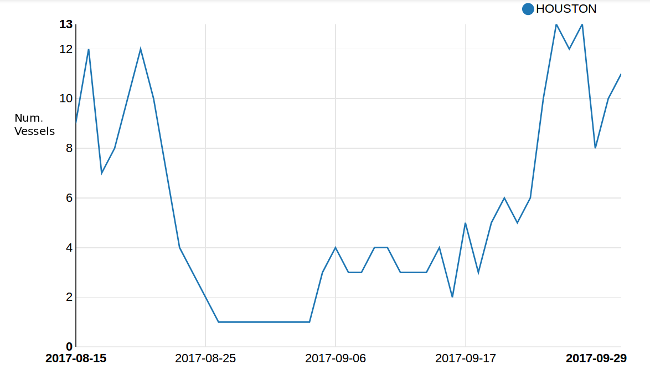
This shows the density of unique cargo and tanker vessels for Port Houston, Texas across a the specified time range. The obvious lull of activity marks the region of time surrounding hurricane Harvey, and we can easily see how long vessel traffic was significantly affected for this port as well as the rate at which it recovered.
We can see the same story visually by creating heatmaps near Houston, Texas for date ranges before, during, and after the hurricane. Below we see that activity in the hurricane’s date range is restricted primarily to the port—that is, the ships are in port and moored.
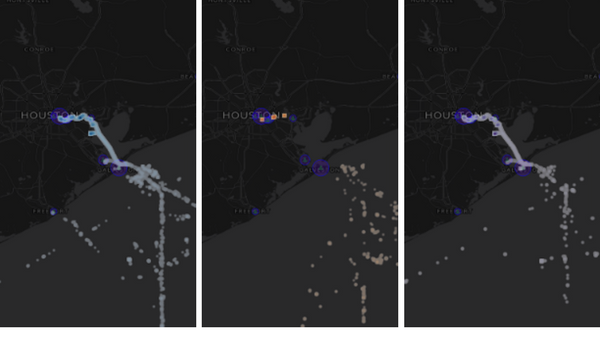
The above heatmaps show cargo and tanker vessel traffic near the Port of Houston before, during, and after Hurricane Harvey.
These are just two examples of how this toolset lets us explore the hurricane’s effect on different sectors and how long these sectors’ shipping pipelines may take to recover. GeoMesa’s Spark SQL capabilities let us easily reach insights based on millions of records using SQL queries rather than writing a complex, distributed analytic.
Similar applications abound for IoT and other tracking applications. The growing number of players in the booming field of Location Intelligence are providing new kinds of spatio-temporal data every day, and LocationTech GeoMesa continues to provide new tools to gain insight from large-scale combinations of this data.
Additional information:
About the Authors