What's new in Eclipse PHP Development Tools (PDT) 5.0
The Eclipse Oxygen release was yet another productive year for the Eclipse PHP Development Tools (PDT) project. During the Oxygen development cycle (July 2016 – June 2017) the PDT project had released feature versions for every update of the Eclipse Simultaneous Release: PDT 4.1 with Neon.1, PDT 4.2 with Neon.2 , PDT 4.3 with Neon.3 and PDT 5.0 with Oxygen due June 28, 2017.
In these four releases we introduced support for PHP 7.1, tools for Composer, PHPUnit and PHP profiling, an integration with the Built-in PHP Server, and more. Each of them will be covered in details in the next lines.
Last but not least, during the last year we welcomed two new committers to the PDT project – great news for the project’s diversity and future.
PHP 7.1
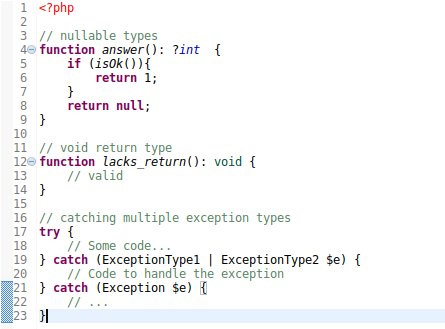
The initial PHP 7.1 support was introduced in PDT 4.1 and was completed in PDT 4.3. The code editor supports all the new cool features in PHP 7.1, including:
- Nullable types
- Void return type
- Iterable pseudo-type
- Class constant visibility modifiers
- Square bracket syntax for
list() - Ability to specify keys in
list() - Catching multiple exceptions types
Composer
Composer is one of the most popular tools for PHP developers nowadays. A Composer plugin existed for years in the PDT Extension Group project. It has been contributed to Eclipse PDT and since then a lot of additional improvements have been done on it.
At present, in PDT 5.0, the Composer tooling provides two new project wizards: “Empty Composer Project” and “PHP Project from Composer Package”.
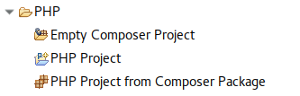
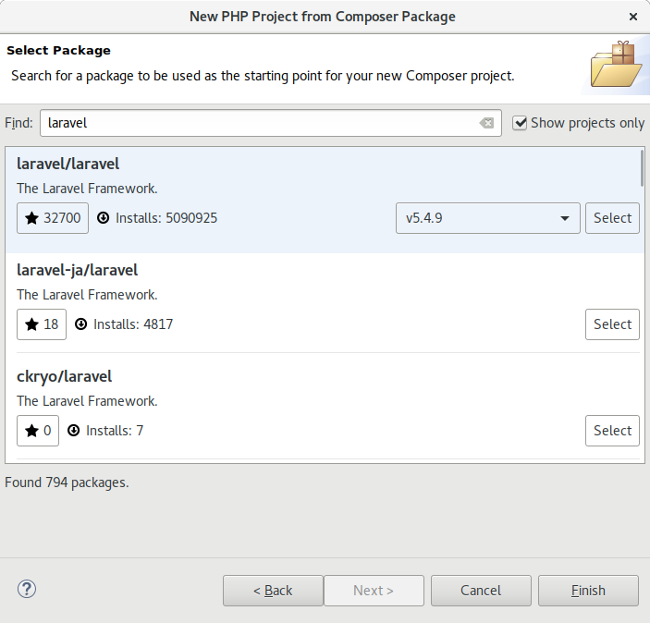
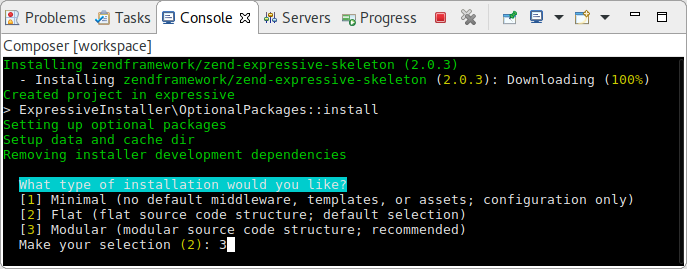
The “PHP Project from Composer Package” wizard is particularly useful when starting new project from the skeleton of a PHP framework like Laravel, Symfony and Zend Framework. It acts in the same way as if the 'composer create-project' command has been executed.
The output of the Composer tooling is printed in the Console view. The Console view integrates the Terminal component, which allows displaying the output in a native way – with the nice ANSI coloring and progress display.
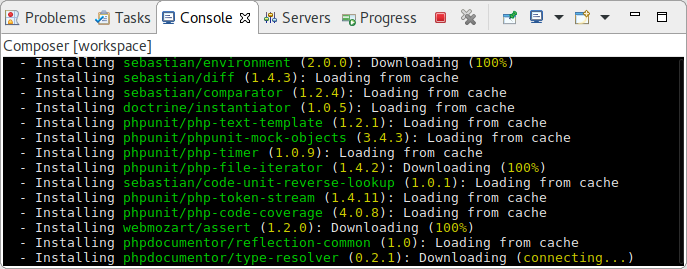
Interactive user input is also supported for those situation where Composer requires some input from the user.
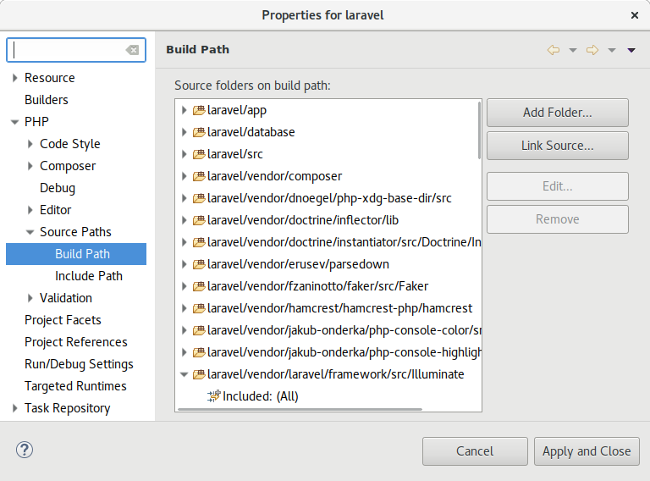
When dependencies are installed, the Composer tooling scans the “autoload” section of the project’s composer.json file and adds all declared namespaces to the project’s build path. The same is done recursively for all project’s dependencies. This way all autoloading classes are indexed and available to the PDT intellisense features.
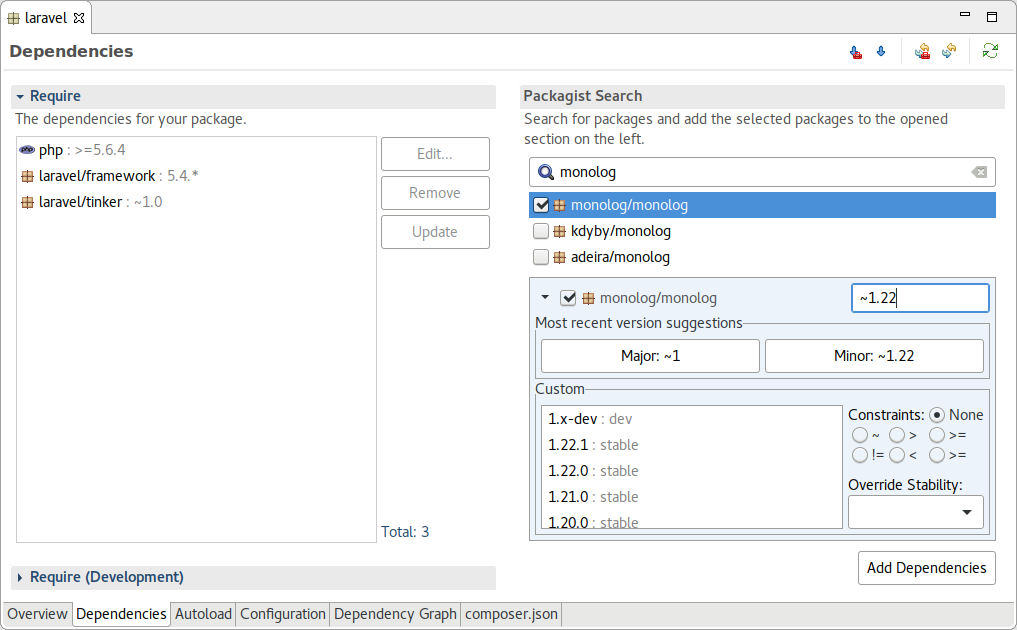
A verbose graphical multi tab editor is provided for the composer.json file. It makes it easier to embrace all the configuration options. Adding new dependencies is easier as the editor queries the Packagist API to list the available Composer packages and their versions. Handy buttons in the editor’s toolbar can be used to install and update the selected dependencies.
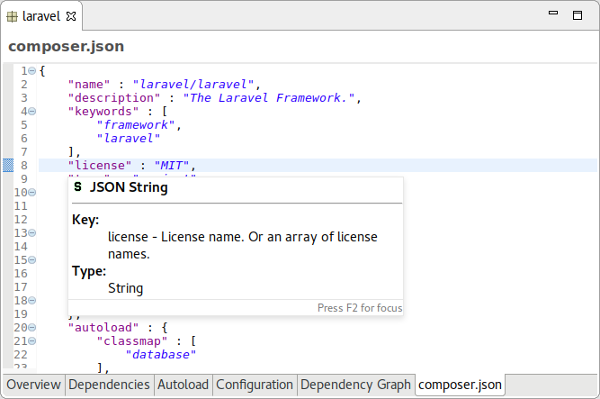
For those of you who prefer working with the composer.json in text mode, the last tab provides a source view of the file that embeds the JSON editor, which provides intellisense according to the Composer’s JSON schema: code assist, syntax validation, hover info, etc.
PHPUnit
PHPUnit is another popular tool that PDT 5.0 introduces integration with. The PHPUnit tooling was a feature of the Zend Studio commercial PHP IDE for long years and is now contributed to PDT. As part of the contribution, the integration has been updated to the latest major release of PHPUnit – 6.x.
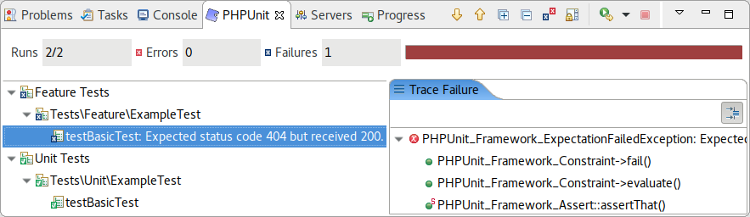
Running PHPUnit tests is as simple as calling “Run As → PHPUnit Test” on the project, a folder, or a specific test file. The test results are displayed in the designated PHPUnit view. It gives an overview of all tests: passed or failed. A detailed Trace Failure view is available for each failed test, which makes easier to determine the reason for the test failure.
Debugging PHPUnit tests can be easily done by running them with “Debug As → PHPUnit Test”. Breakpoints placed in the tests will pause the execution and allow step-debugging with the PHP debugger (Xdebug or Zend Debugger).
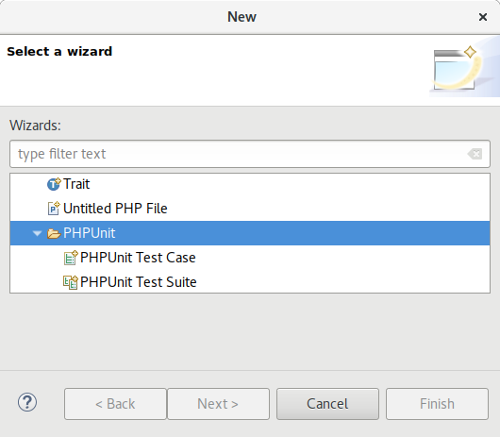
New test cases and test suites can be easily created by using the “PHPUnit Test Case” and “PHPUnit Test Suite” file wizards.
PHP Profiling
Profiling is not a common development task. But when it comes to resolving performance issues, profiling the code execution is a proven way to detect the bottlenecks.
The PHP profiling feature introduced in PDT 5.0 is another contribution from Zend Studio. It allows code profiling of:
- PHP scripts
- PHP web apps
- PHPUnit tests
Simply use the Profile As submenu from the Project Explorer’s context menu and choose the desired profile action.
The results are displayed in a designated PHP Profile perspective, which contains several views with profiling information.
The “Profile Information” view provides general information on the profiling duration and date, number of files constructing the requested URL and more. In addition, it displays a Time Division pie chart for the files in the URL.

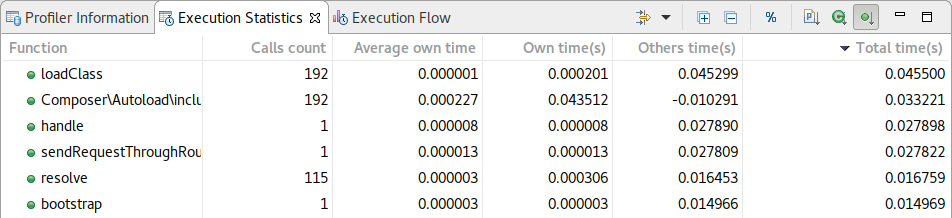
The “Execution Statistics” view displays the list of files that were called during the profiling process and detailed information on processing times for elements within the files. The window contains statistics relevant to each element as follows:
- Function - The name and location of the function.
- Calls Count - The number of times that the function was called.
- Average Own Time - The average duration without internal calls.
- Own Time(s) - The net process duration without internal calls.
- Others Time(s) - Time spent on calling other files.
- Total Time(s) - The total time taken to process.
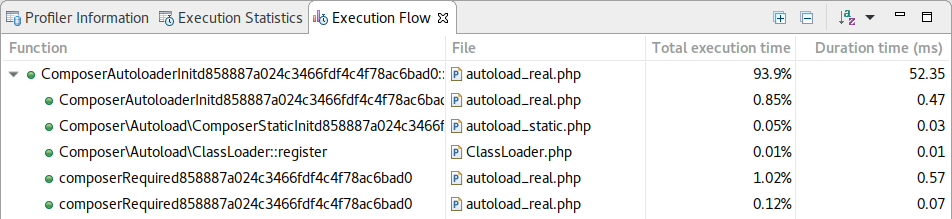
The “Execution Flow” view shows the flow of the execution process and summarizes percentages and times spent on each function.
- Function - Function name.
- File - The file in which the function is located.
- Total Execution Time - Percent of time taken per function.
- Duration Time - Time taken per function in milliseconds.
Right-clicking a function in the list gives you the option to:
- View Function Call - Will open the selected function call in the editor.
- View Function Declaration - Will open the selected function declaration in the editor.
- Open Function Invocation statistics - Will open a view with statistics about the selected function, the functions it was invoked by and functions it invoked.
Currently, it is required to have Zend Debugger configured and enabled in the PHP runtime. Xdebug is not supported yet.
Built-in PHP Server
The built-in web server is a feature of PHP that allows to quickly launch a lightweight web server for development purposes like testing and debugging.
Thanks to Alex Xu – our latest PDT committer – PDT 5.0 now introduces an integration of the built-in PHP server with the server framework of the Eclipse Web Tools Platform (WTP). Those of you, who are familiar with the WTP Servers workflow, will find the same way of running and debugging web apps written in PHP – even better – without the need to setup a PHP web server!
For those of you who are new to the WTP Servers workflow, here is how it works:
- Right-click on the PHP project or a PHP file and call “Run As → Run On Server”.
- Select the PHP Built-in Server from the list of available server types and click Next.
- Pick a PHP executable to be used as the runtime for the built-in server.
- Click Finish to have the server started and the PHP project published.
- The internal web browser will appear showing the requested project or file.
In a similar way you can debug on the built-in server if the selected PHP executable has Xdebug or Zend Debugger configured. Just use “Debug As → Debug On Server” instead of “Run As → Run On Server”.
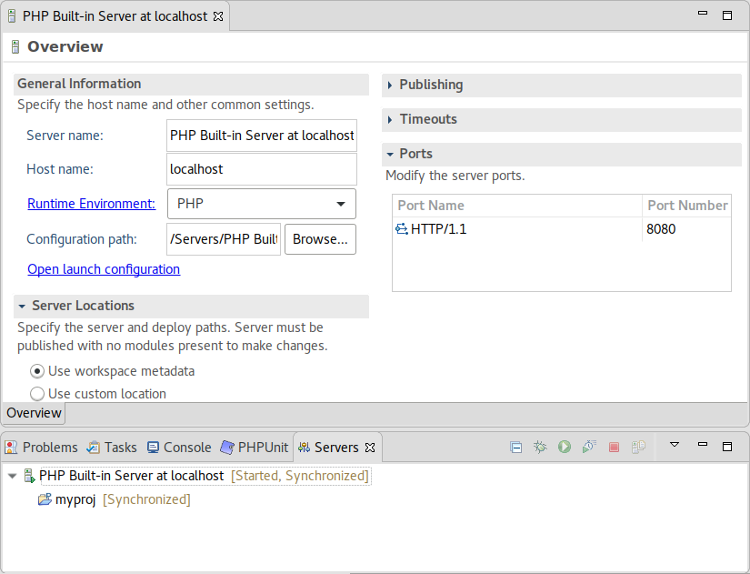
The built-in PHP server can be managed from the Servers view. You can start, stop and restart it, add and remove PHP projects. Double-clicking on the server’s node opens the server editor with some configuration options, e.g. setting the server’s HTTP port.
And more…
We've just seen the a selection of the major new features and improvements. There are many more big and small improvements included in the Oxygen release like:
- New mechanism for organizing use statements: sorting, removing of unused and adding unimported use statements
- Wizards for creating PHP classes, interfaces and traits
- Wizard for generation setter and getter methods
- Improved PHP syntax check and validation
- Improved structure of the PHP preferences
Visit the New & Noteworthy pages of PDT 4.1, PDT 4.2, PDT 4.3 and PDT 5.0 for the complete list of changes. The PDT team closed more than 250 Bugzilla items in the last 12 months.
How to get it
There are many ways for getting the latest Eclipse PDT tools:
- Download the “Eclipse for PHP Developers” package from the Eclipse Downloads page
- Use the Eclipse Installer to install the “Eclipse IDE for PHP Developers” profile
- Extend your existing Eclipse installation by installing the “PHP Development Tools (PDT)” feature from:
- The Eclipse Marketplace
- The Eclipse Oxygen Simultaneous Release software repository
Contact us
We want to hear from you! You can reach us in our user forum and in our developers mailing list. Tell us what you like and what not in Eclipse PDT.
Please report bugs in the project's Bugzilla.
Happy PHPing!
About the Author