| Performance Statistics |
The modular nature of Eclipse makes for a highly dynamic execution environment. What happens when a context menu is opened in a view, or when the user switches to a different perspective, depends on the set of plug-ins that are installed and the set of plug-ins that are loaded at the time of the event. While this execution model has powerful advantages, it makes it difficult to track down performance problems in an Eclipse-based application. For example, a user may report that it takes five seconds to open a view's context menu. The long pause may be caused by:
The crux is that it is difficult to put a finger on exactly where all the time (or memory) is going in a particular user scenario. While detailed analysis of performance is properly the domain of dedicated profiling tools, some level of instrumentation in the Eclipse code can make it easier to narrow the scope of performance problems. In other words, if a user has downloaded a dozen different plug-ins from the web, and suddenly things get slow or memory usage shoots up, a quick tool is needed to help that user figure out who to report the performance problem to.
The new PerformanceStats class in Eclipse 3.1 is a light-weight API
for tracking plug-in performance and reporting performance problems in a running
Eclipse-based application. This API is used to track performance events,
pieces of code that are potentially long-running or that involve calls across a
plug-in boundary. These events often correspond to a user's interaction with an
application (an editor or menu being opened, a builder running, etc), or system
events such as event listeners being called.
The principle design characteristics of the PerformanceStats API are:
The PerformanceStats infrastructure builds on the existing debug
trace options and logging support in the platform, so its implementation is
small and most of its function should be familiar for those acquainted with
the Eclipse tracing and logging APIs. Performance event tracking is only turned
on when Eclipse is in debug mode (-debug command line argument), and the following
line exists in the debug trace options file:
org.eclipse.core.runtime/perf=true
PerformanceStats.ENABLED can be used to quickly
determine whether performance tracing is turned on.
The first step to using PerformanceStats is to instrument potentially
long-running code. Here is an example snippet where code has been instrumented
to gather performance statistics:
	private static final String PERF_BUILDER = "org.eclipse.core.resources/perf/builders";
	...
	PerformanceStats stats = PerformanceStats.getStats(PERF_BUILDER, builder);
	stats.startRun();
	builder.build(...);//this is the expensive code being called
	stats.endRun();
A statistics instance is created by providing a symbolic name for the event,
and an arbitrary object, called the blame, that identifies the party
responsible for the event that is occurring. This is typically the object on
which a long-running method is being called. If no object is applicable,
a string can be provided that contains further details, such as an extension or
plug-in id. Once created, the statistics instance can be held onto privately, or
looked up using the static getStats method whenever it is needed.
As a system runs, a large number of performance events will typically occur.
Most of the time, these events occur quickly, and it is not interesting to
track or report their occurrence. The PerformanceStats mechanism
uses the notion of failure events to distinguish performance events
that take longer than an acceptable duration. Thus you may not be interested
in the fact that a given menu was opened a thousand times, but you may be
interested in the one time when it took several seconds to open.
Performance failures are calculated using threshold values supplied using a debug
trace option. The supplied value indicates the maximum acceptable duration
for a particular kind of event. The name of the trace option is the same as the
symbolic event name that is supplied when a PerformanceStats
instance is created. For example, the following line from a debug trace
options file (.options), indicates that activation of a workbench
part must take less than 200 milliseconds. Part activations that take longer than
the specified threshold will be recorded as failure events.
org.eclipse.ui/perf/part.activate=200
When a performance run is ended, an optional context string can be
provided that contains more details about the event. The context is provided
by calling endRun(String context) rather than the no-argument
endRun() method. This context information is only stored
and reported in the case of performance failures. Performance statistics
are not tracked separately for different contexts on the same statistics object.
For example, the context for a part change event might be the kind of change
and the name of the target part. Thus while all invocations of a particular
part listener are aggregated into a single statistic, further details are available
in the case of a particular invocation whose duration is longer than the
threshold value specified in the debug options file.
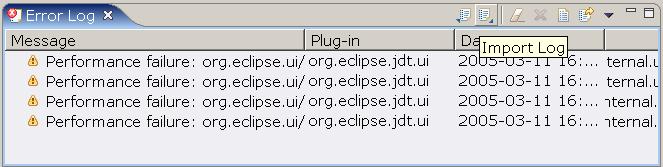
Performance failures are written to a log file, performance.log in the metadata area. This log is found in the same directory as the error log (.log). The performance log has the same format as the error log, so it can be viewed in the PDE error log view by selecting "Import Log" from the tool bar:
The "Plug-in" column in the log view will show what plugin is responsible for the performance failure, computed based on the blame object provided to the performance stats API. Double-clicking on a performance failure in the log view will show a stack trace of the execution state at the time of the failure.
If you want to take some other action when performance failures occur, you can
register a PerformanceListener with PerformanceStats
that will be notified when performance
events occur. Performance listeners are notified periodically in a separate thread,
to ensure they don't affect the performance of the event being measured. Thus
you can use a listener to write performance data to a file or database without fear
of slowing anything else down.